Prometheus : Visualize on Grafana |
Web UI is included in Prometheus but it's also possible to visualize time series data on Grafana. | |
| [1] | Install Grafana, refer to here. It's OK to install it on any Node. (install it on Prometheus server Node on this example) |
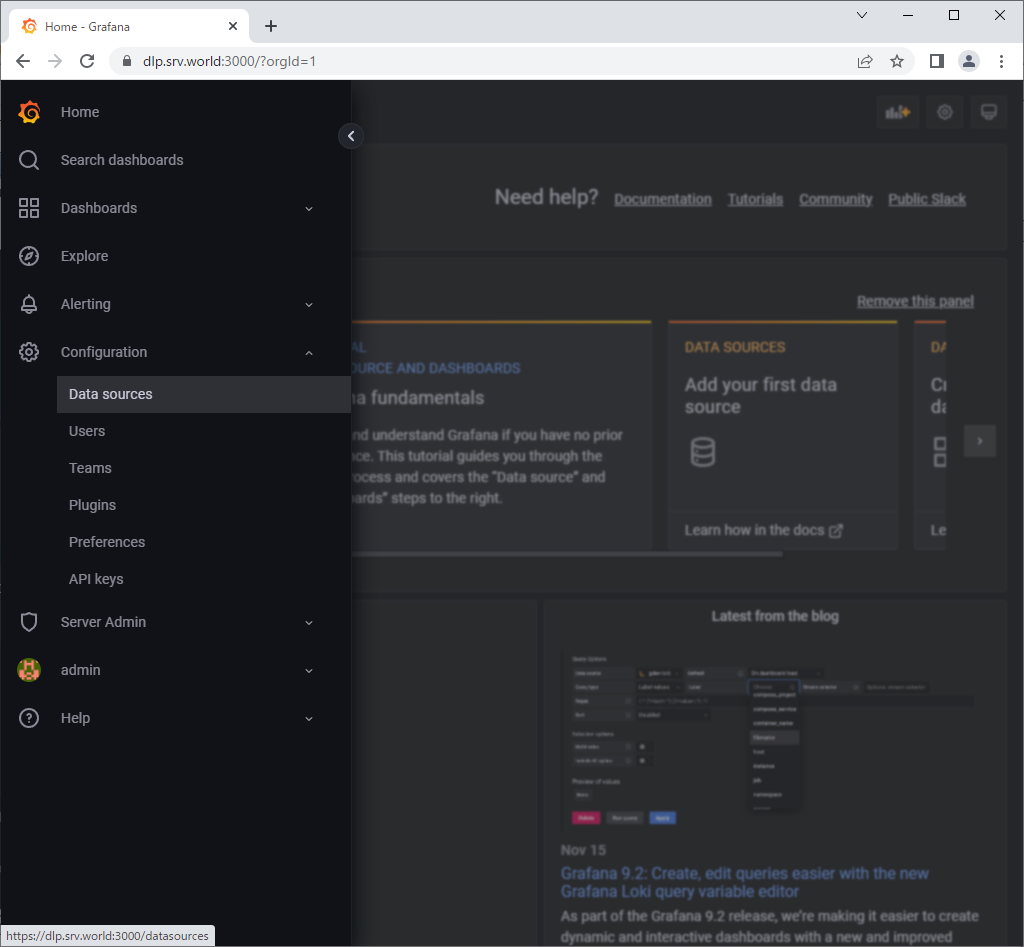
| [2] | Access to Grafana Dashboard and Open [Configuration] - [Data Sources] on the left menu. |
 |
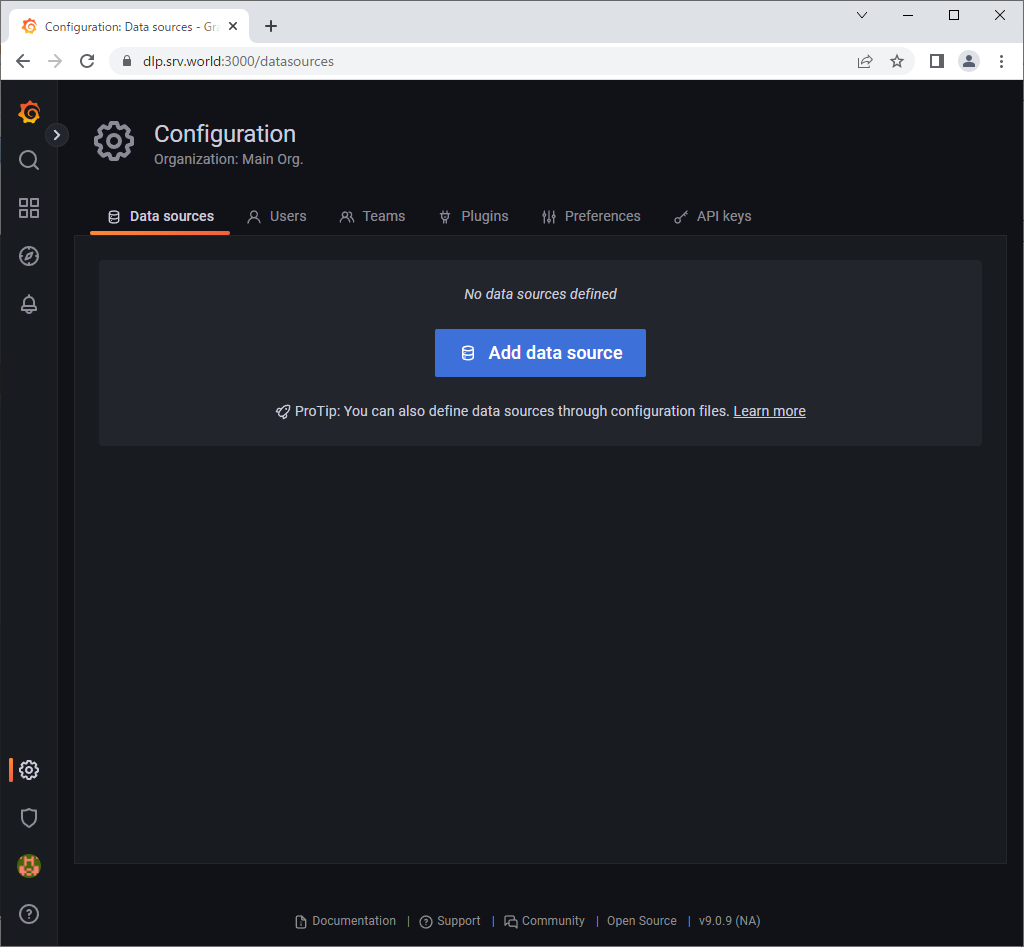
| [3] | Click [Add data source]. |
 |
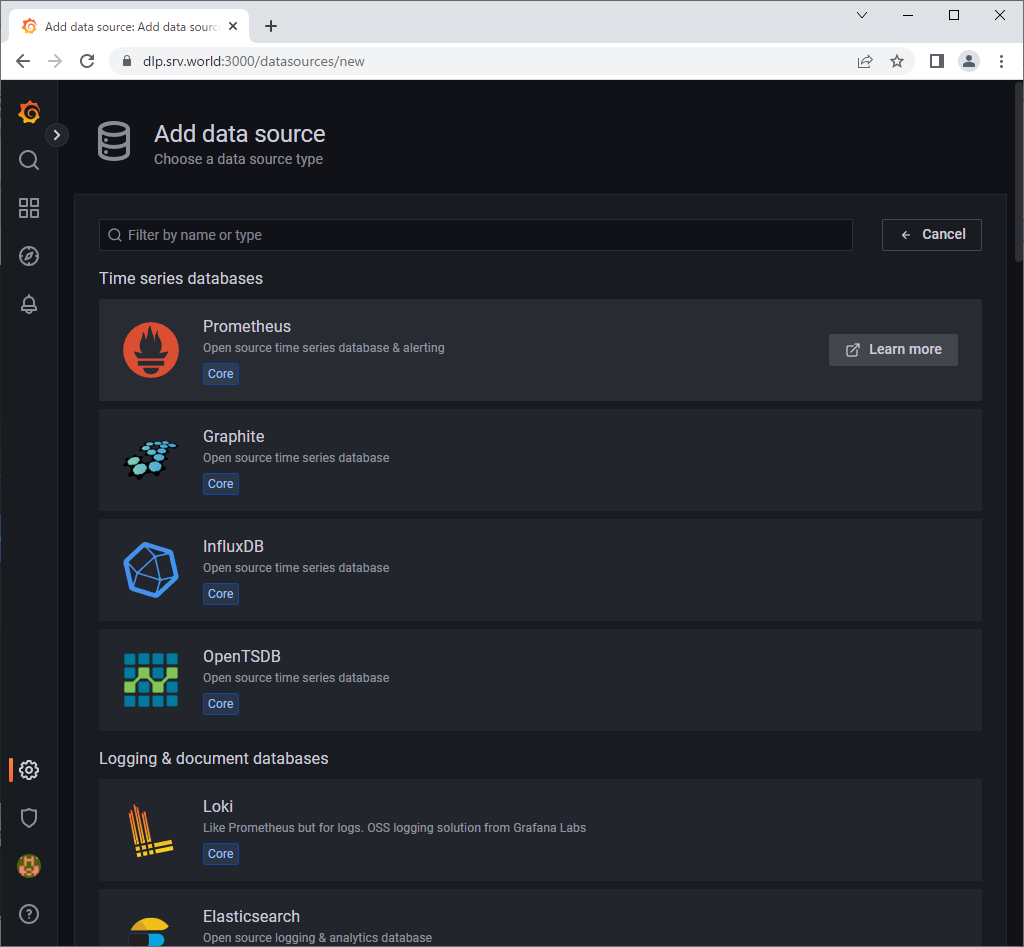
| [4] | Click [Prometheus]. |
 |
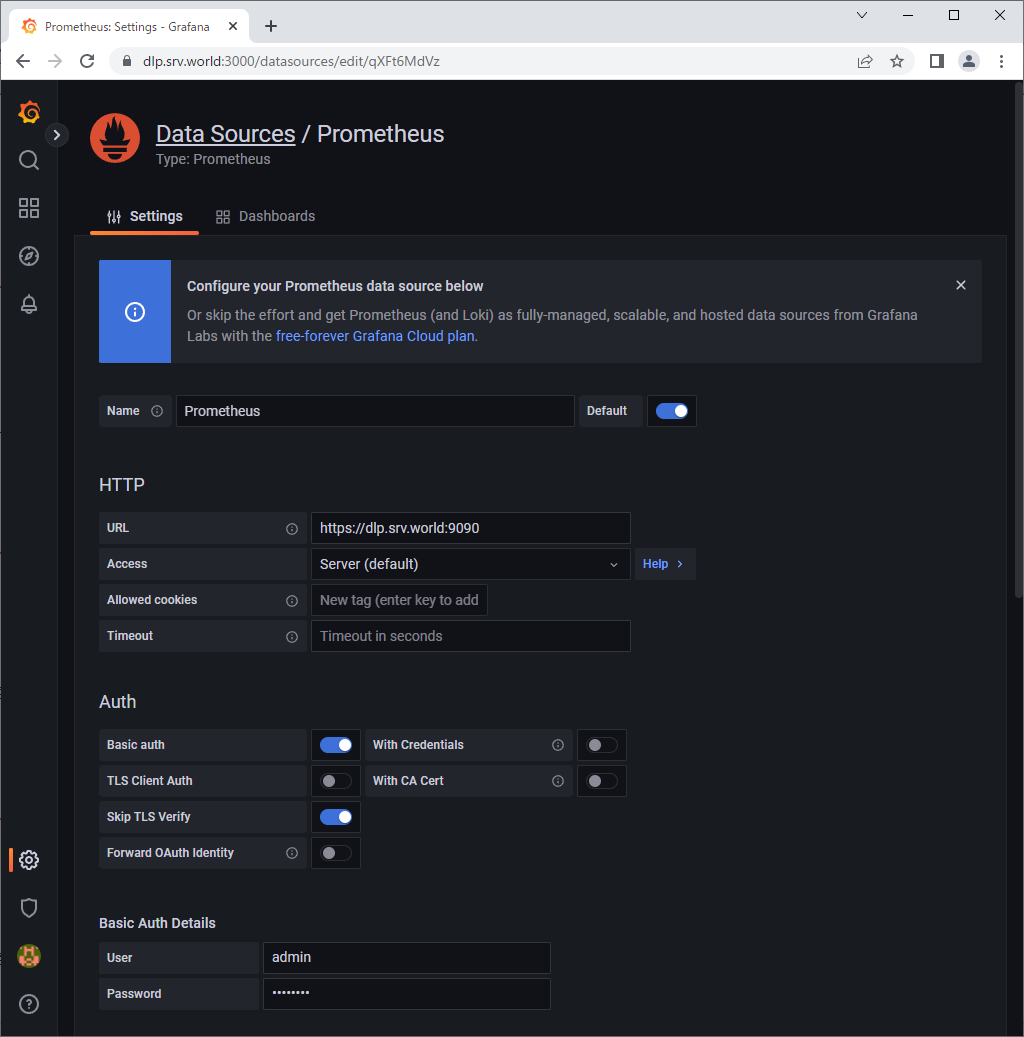
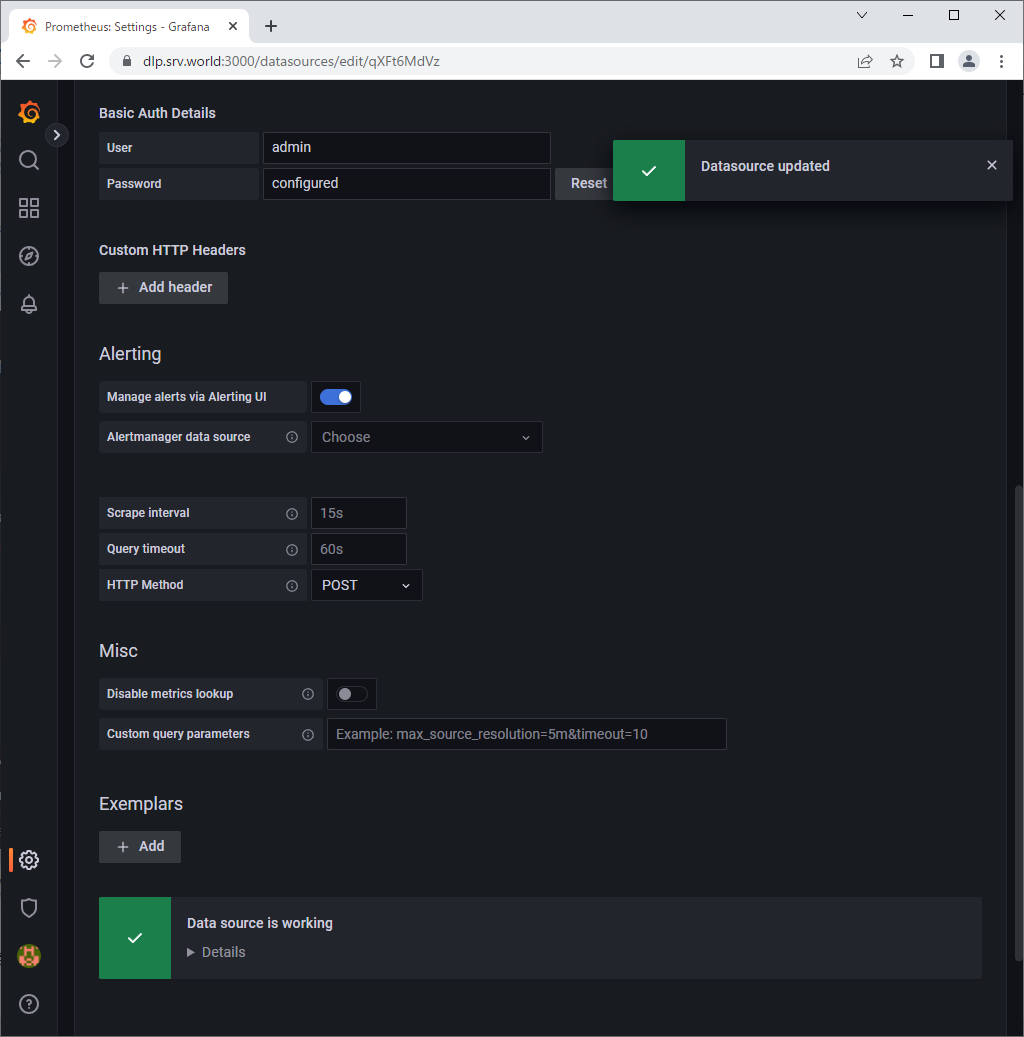
| [5] | Input Prometheus Server endpoint URL on [URL] field and Click [Save & Test] button which is bottom of the page. If you enabled authentication or HTTPS, set parameters for them, too. |
 |
| [6] | The message [Data source is working] is shown if that's OK. |
 |
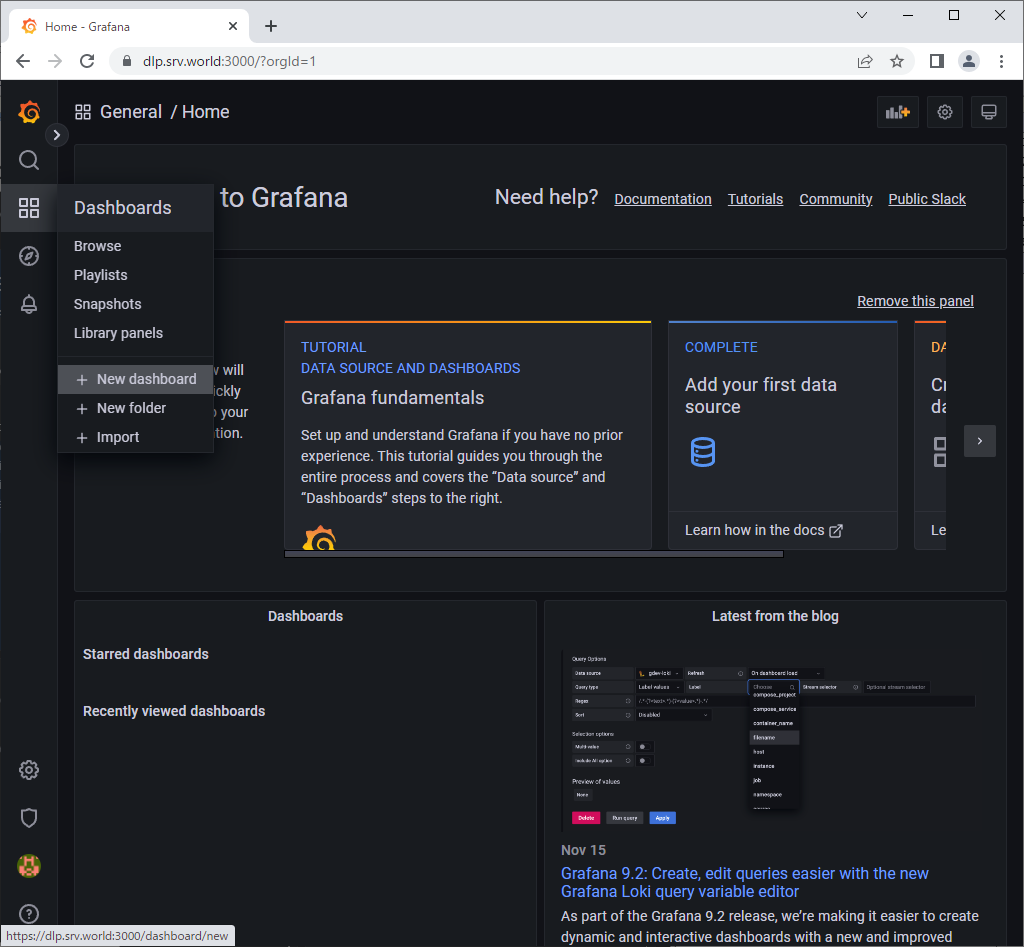
| [7] | Next, Open [Dashboard] - [New dashboard] on the left menu. |
 |
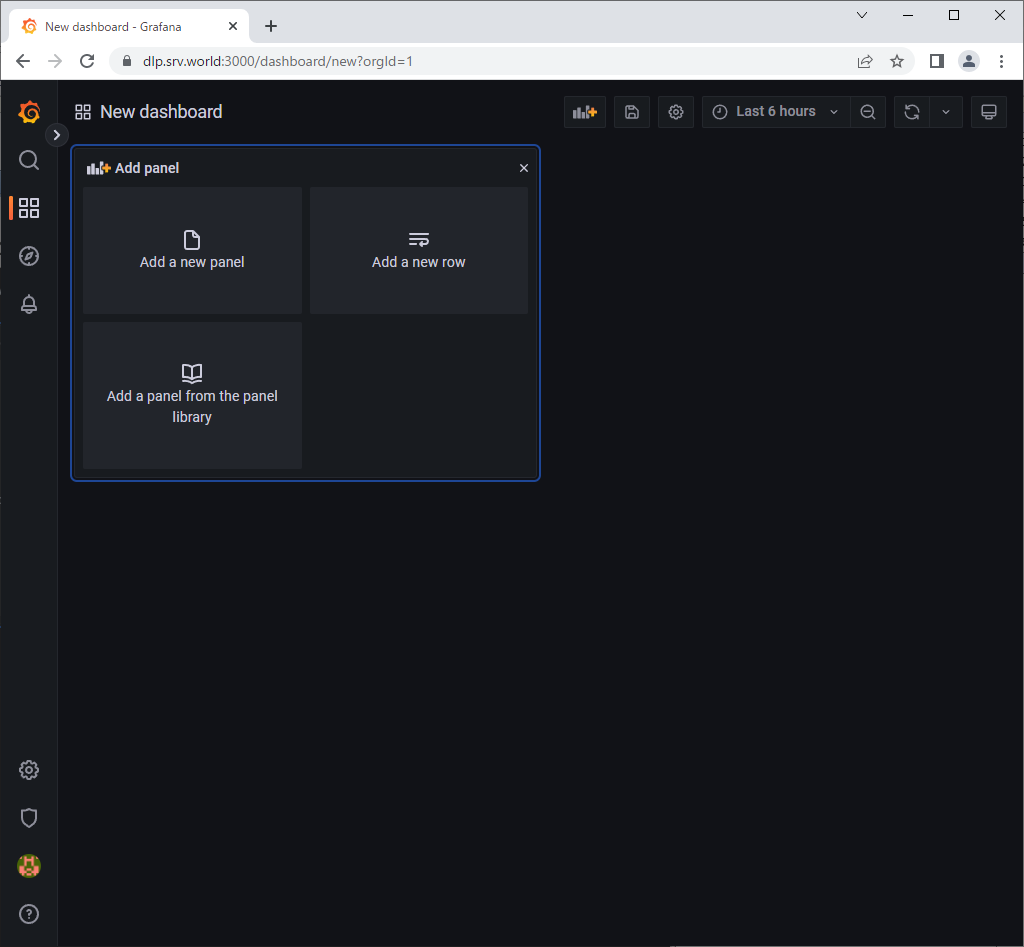
| [8] | Click [Add a new panel]. |
 |
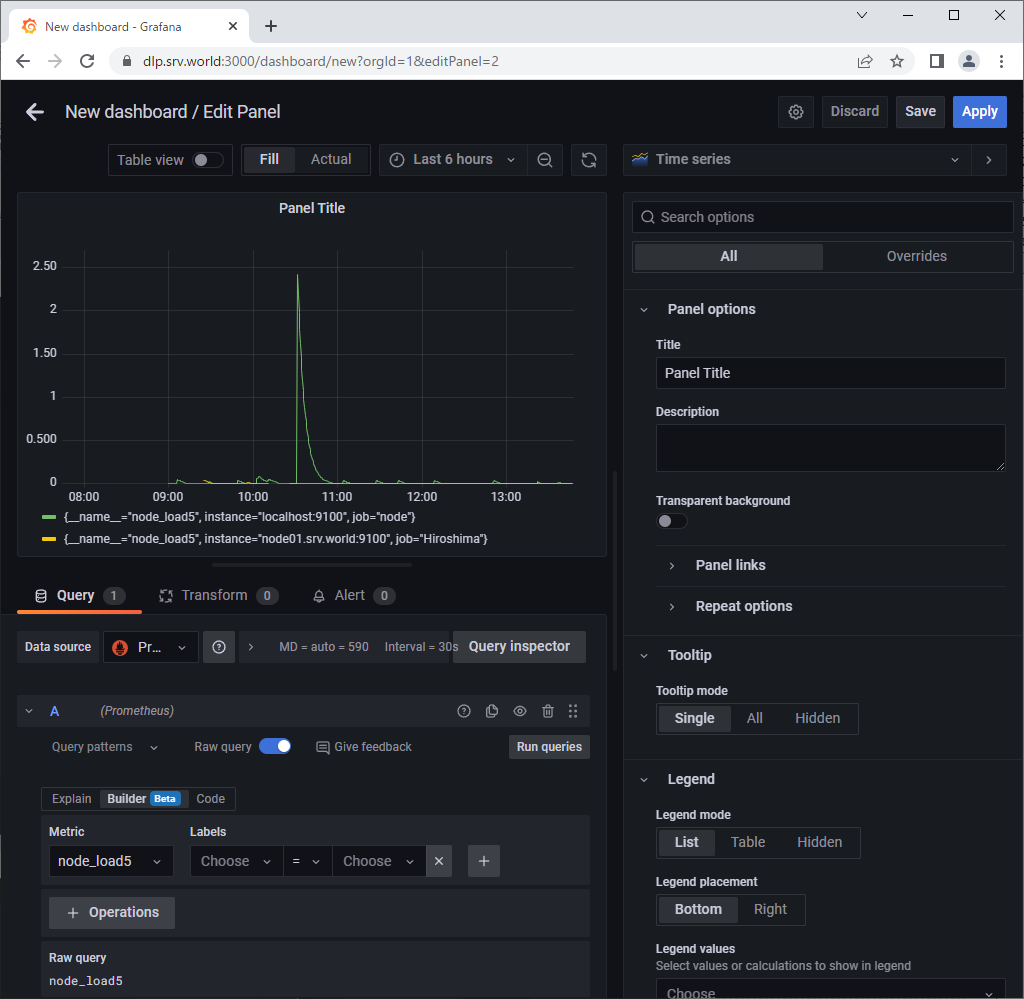
| [9] | Select a query you'd like to visualize data on [Metrics] field. |
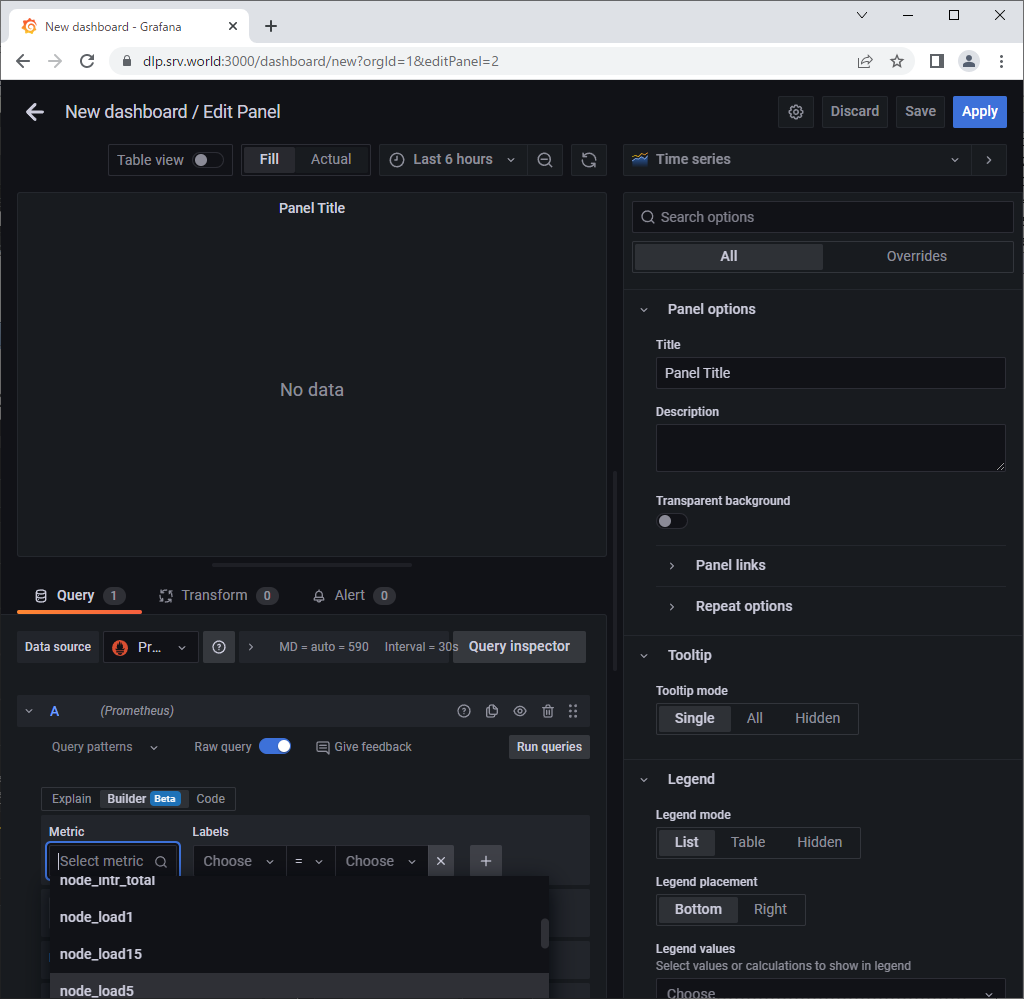 |
| [10] | After selecting a query, visualized graph is shown. To save [Dashboard], Click [Save] button. |
 |
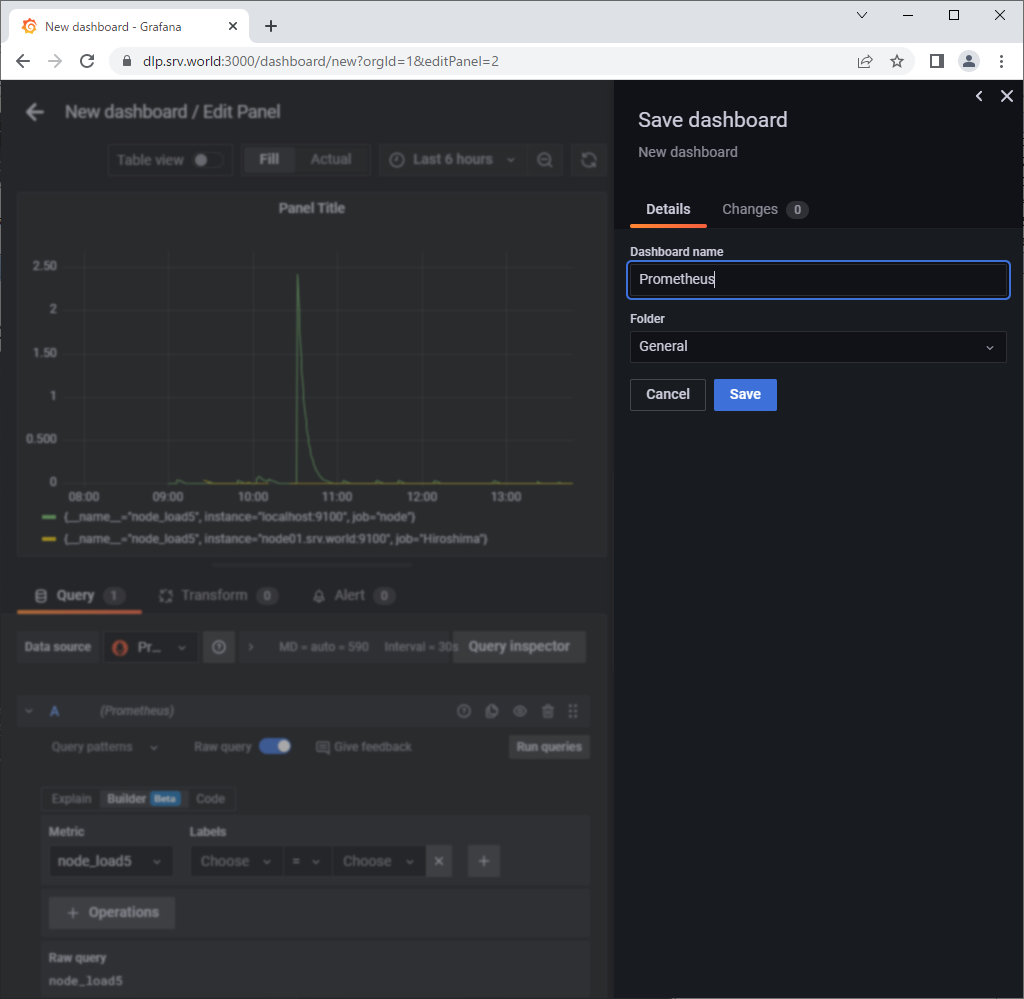
| [11] | Set any Dashboard name and Click [Save] button. |
 |
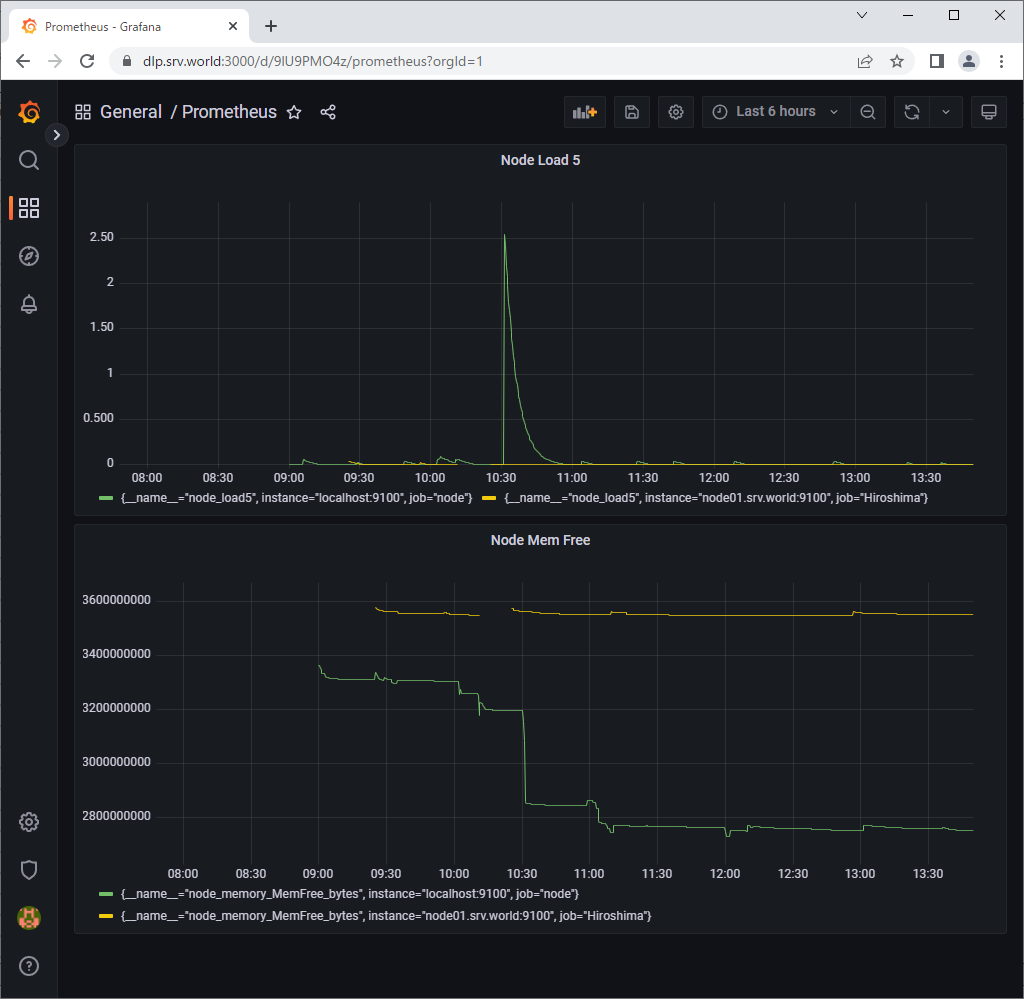
| [12] | To add more queries, it's possible to put more Graphs on a Dashboard. |
 |
No comments:
Post a Comment