Zabbix 7.0 : Add Monitoring Target (CentOS) |
Add Monitoring Target Host. Add a CentOS Stream 9 server as an example on here. | |
| [1] | Install Zabbix Agent on the server you'd like to add for monitoring target. |
[root@node01 ~]# dnf -y install https://repo.zabbix.com/zabbix/7.0/centos/9/x86_64/zabbix-release-7.0-5.el9.noarch.rpm [root@node01 ~]# dnf -y install zabbix-agent2 [root@node01 ~]# vi /etc/zabbix/zabbix_agent2.conf # line 80 : specify Zabbix server Server= 10.0.0.30 # line 133 : specify Zabbix server ServerActive= 10.0.0.30 # line 144 : change to your hostname Hostname= node01.srv.world systemctl enable --now zabbix-agent2 |
| [2] | If SELinux is enabled, change policy. |
| [root@node01 ~]# setsebool -P domain_can_mmap_files on [root@node01 ~]# vi zabbix_agent.te # create new module zabbix_agent 1.0;
require {
type initctl_t;
type zabbix_agent_t;
type devlog_t;
type proc_kcore_t;
type rpm_exec_t;
type rpm_var_lib_t;
class fifo_file getattr;
class sock_file getattr;
class file { execute execute_no_trans map open getattr };
}
#============= zabbix_agent_t ==============
allow zabbix_agent_t devlog_t:sock_file getattr;
allow zabbix_agent_t initctl_t:fifo_file getattr;
allow zabbix_agent_t proc_kcore_t:file getattr;
allow zabbix_agent_t rpm_var_lib_t:file open;
allow zabbix_agent_t rpm_exec_t:file { execute execute_no_trans map };
checkmodule -m -M -o zabbix_agent.mod zabbix_agent.te [root@node01 ~]# semodule_package --outfile zabbix_agent.pp --module zabbix_agent.mod [root@node01 ~]# semodule -i zabbix_agent.pp |
| [3] | If Firewalld is running, allow Zabbix related ports. |
| [root@node01 ~]# firewall-cmd --add-port=10050/tcp success [root@node01 ~]# firewall-cmd --runtime-to-permanent success |
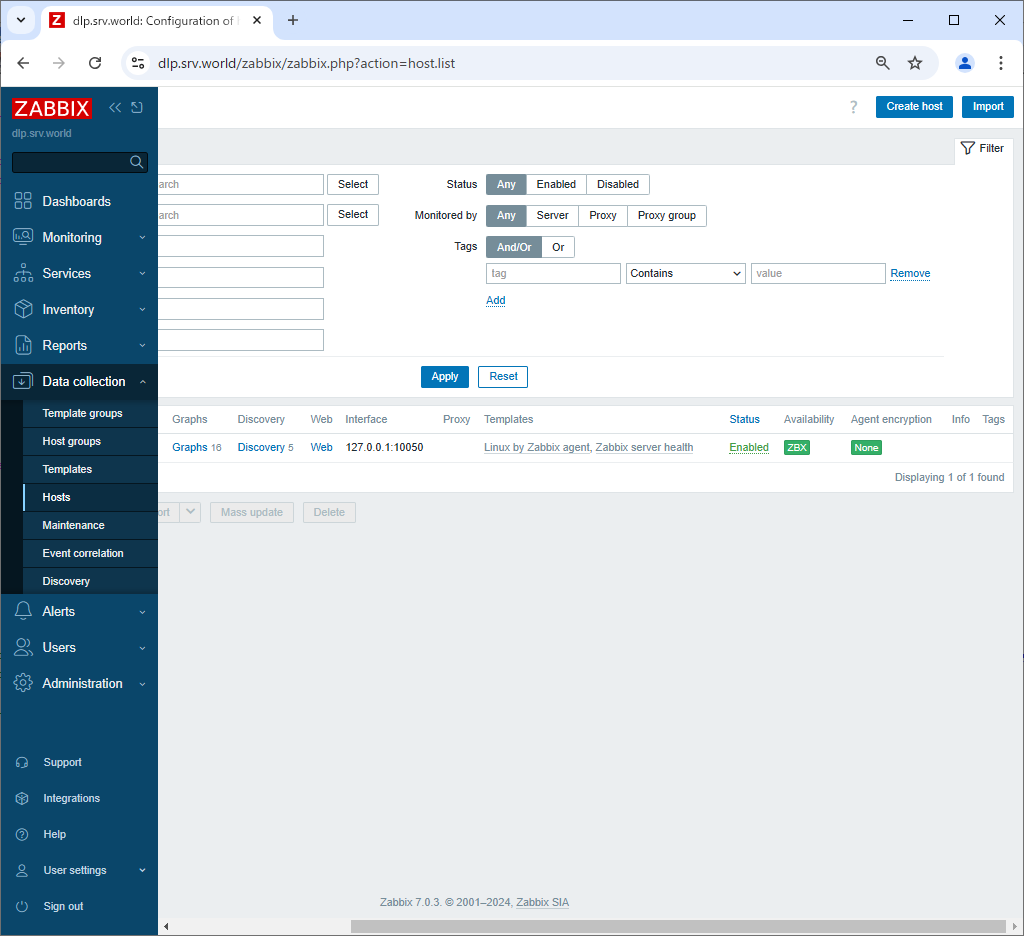
| [4] | Login to Zabbix admin site with [Admin] user and select [Data collection] - [Hosts] on the left pane, then click [Create Host] button on the right pane. |
 |
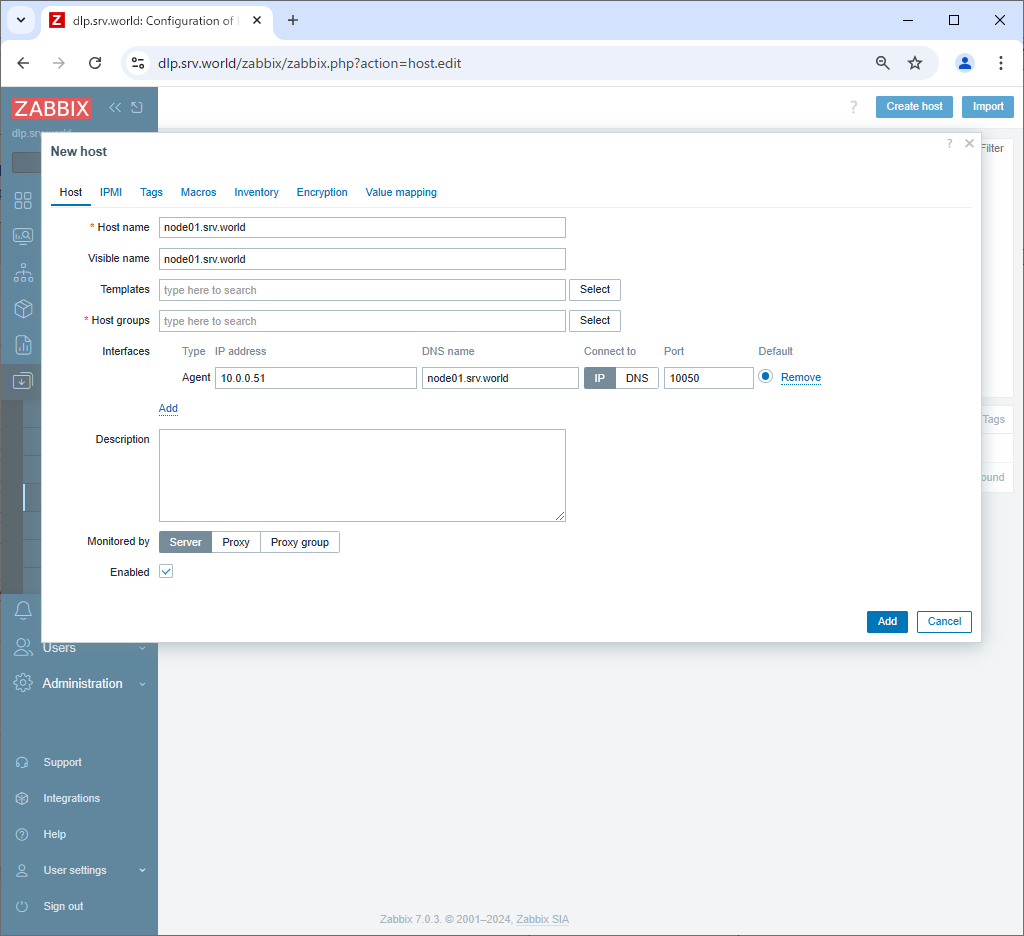
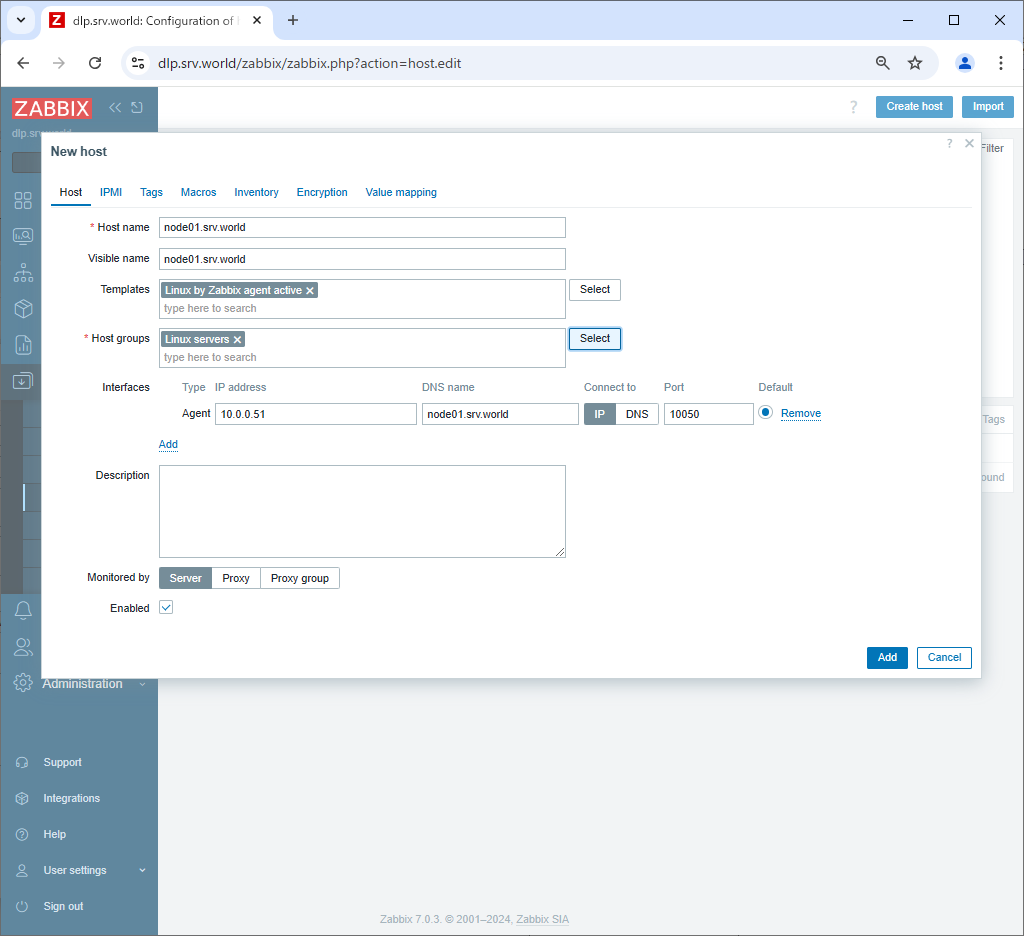
| [5] | Input a hostname for [Hostname] field, input any name you like for [Visible name] field, select a group or add a new group for [Groups] field, input IP address and DNS name for [Interfaces] field. For monitoring items, there are many templates, click [Select] button that is in [Templates] field. |
 |
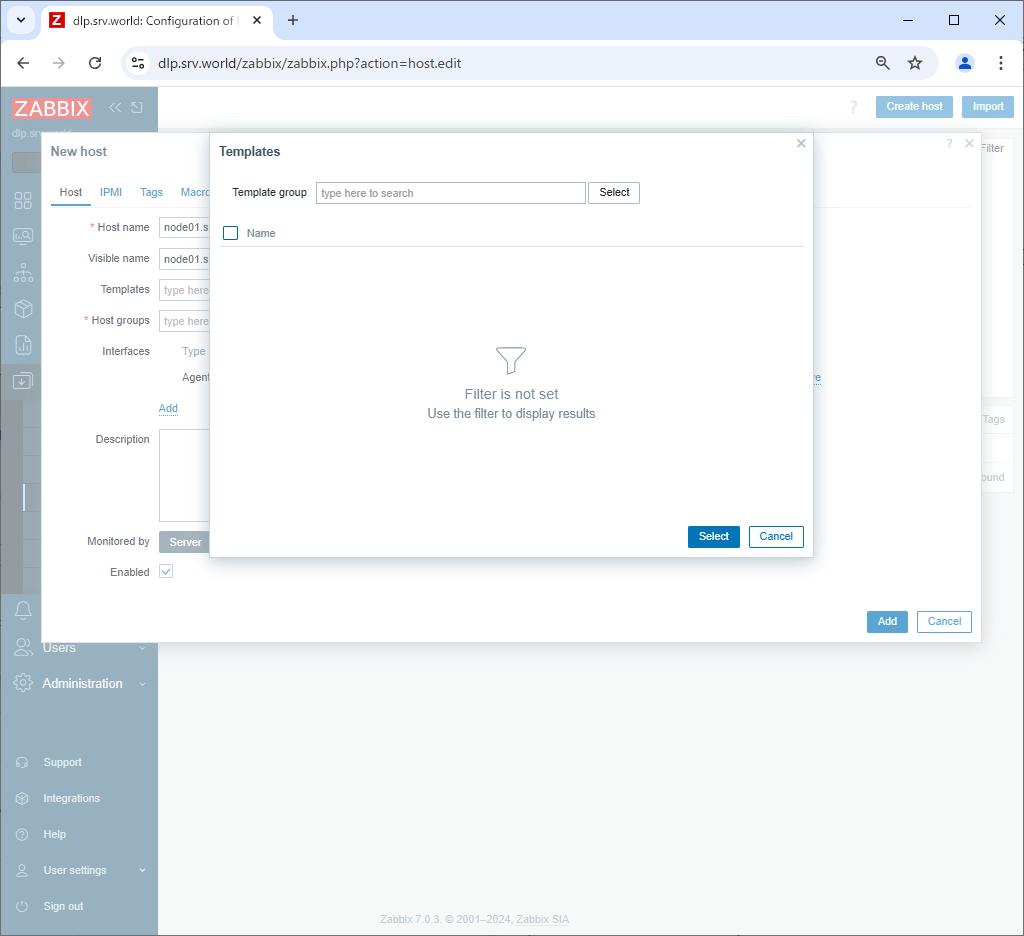
| [6] | Click [Select] button. |
 |
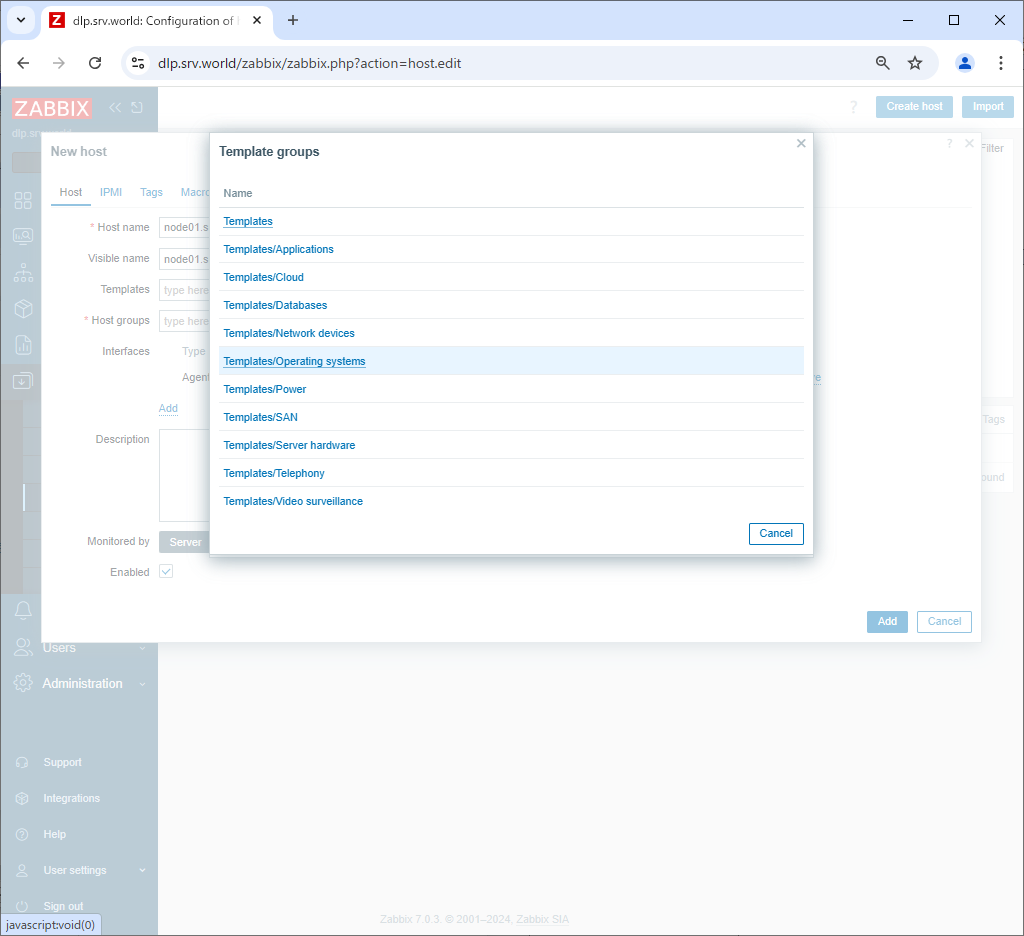
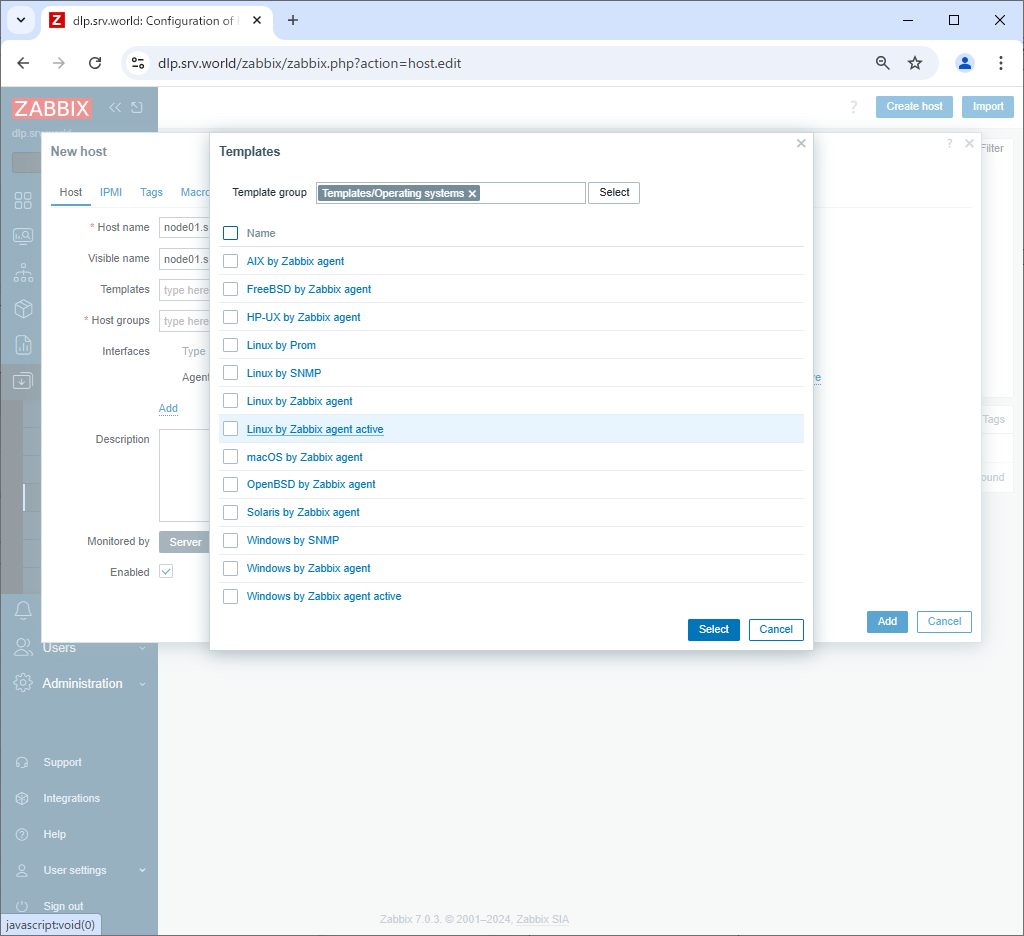
| [7] | Select [Templates/Operating systems]. |
 |
| [8] | Select [Template OS Linux by Zabbix agent active]. The difference between having [active] and not having it is that without [active], the Zabbix server requests the Zabbix agent to send data and the data is sent, while with [active], the Zabbix agent sends data to the Zabbix server according to the configuration. There is not much difference in the items that can be monitored, but with [active], log monitoring is also possible, so set it with [active] on here. However, when there are a large number of hosts to be monitored, you must also consider the load on the Zabbix server when setting with [active]. |
 |
| [9] | After setting items, click [Add] button. |
 |
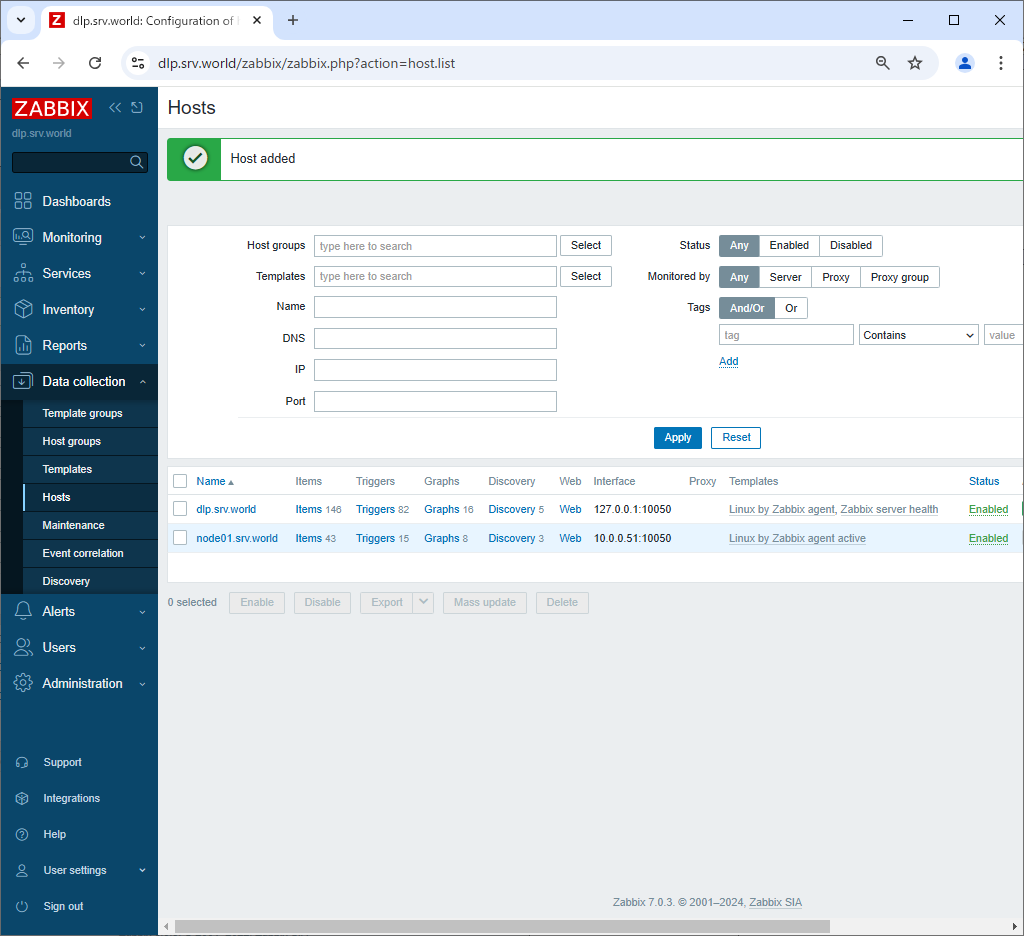
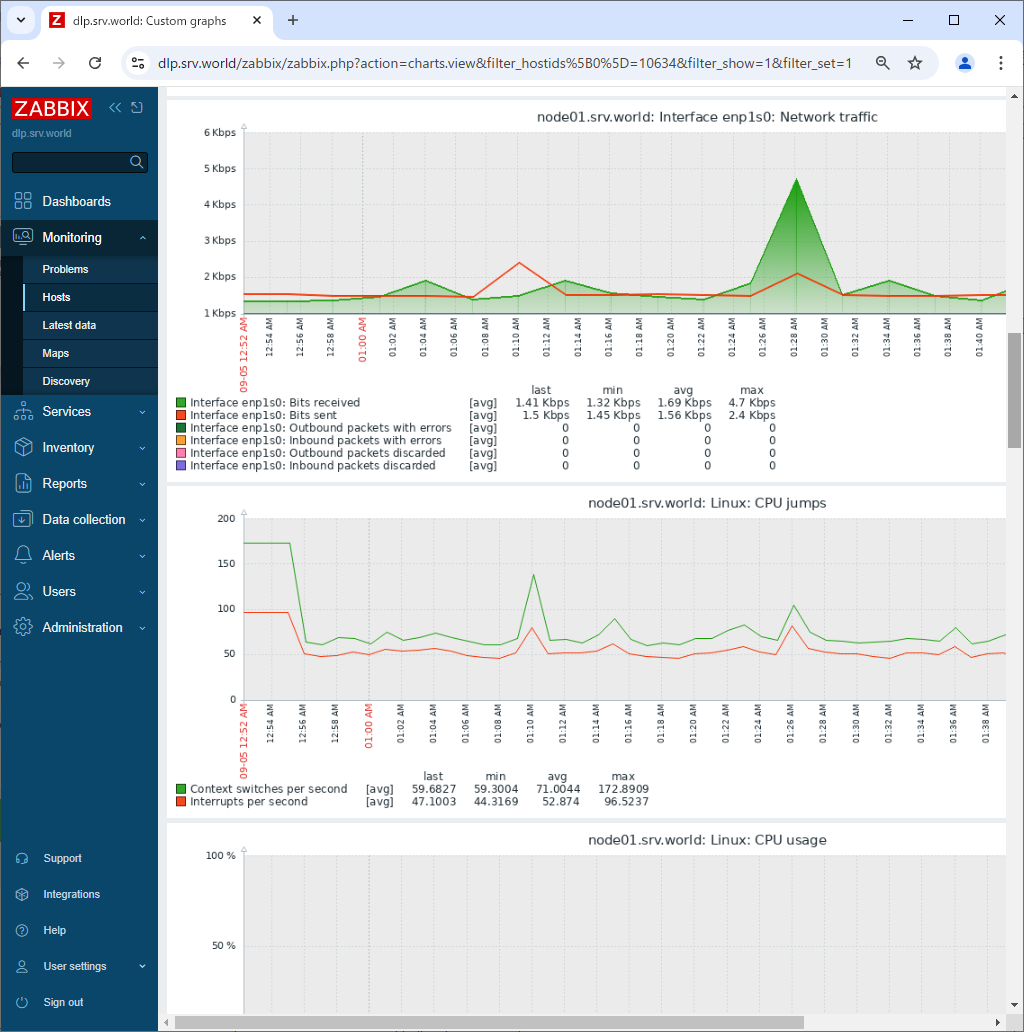
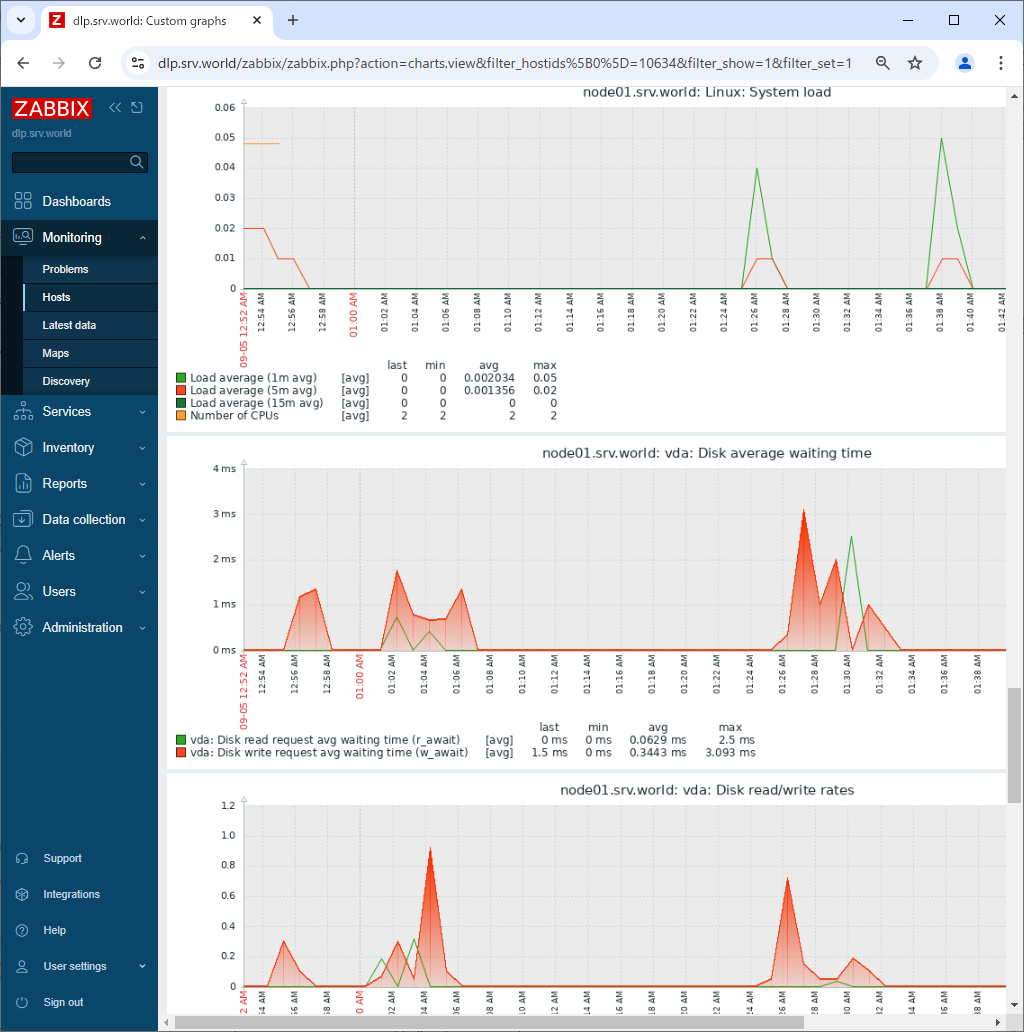
| [10] | New monitoring target host is added. After few minutes, monitoring data are collected like follows. |
 |
 |
 |
No comments:
Post a Comment