Kubernetes : Enable Dashboard |
Enable Dashboard to manage Kubernetes Cluster on Web UI. In this example, a Kubernetes cluster is configured using four nodes as follows. +----------------------+ +----------------------+
| [ ctrl.srv.world ] | | [ dlp.srv.world ] |
| Manager Node | | Control Plane |
+-----------+----------+ +-----------+----------+
eth0|10.0.0.25 eth0|10.0.0.30
| |
------------+--------------------------+-----------
| |
eth0|10.0.0.51 eth0|10.0.0.52
+-----------+----------+ +-----------+----------+
| [ node01.srv.world ] | | [ node02.srv.world ] |
| Worker Node#1 | | Worker Node#2 |
+----------------------+ +----------------------+
|
| [1] | |
| [2] | Enable Dashboard. |
debian@ctrl:~$ debian@ctrl:~$ helm repo add kubernetes-dashboard https://kubernetes.github.io/dashboard/ "kubernetes-dashboard" has been added to your repositories helm install kubernetes-dashboard kubernetes-dashboard/kubernetes-dashboard --create-namespace --namespace kubernetes-dashboard NAME: kubernetes-dashboard
LAST DEPLOYED: Fri Aug 22 19:56:00 2025
NAMESPACE: kubernetes-dashboard
STATUS: deployed
REVISION: 1
TEST SUITE: None
NOTES:
*************************************************************************************************
*** PLEASE BE PATIENT: Kubernetes Dashboard may need a few minutes to get up and become ready ***
*************************************************************************************************
Congratulations! You have just installed Kubernetes Dashboard in your cluster.
To access Dashboard run:
kubectl -n kubernetes-dashboard port-forward svc/kubernetes-dashboard-kong-proxy 8443:443
NOTE: In case port-forward command does not work, make sure that kong service name is correct.
Check the services in Kubernetes Dashboard namespace using:
kubectl -n kubernetes-dashboard get svc
Dashboard will be available at:
https://localhost:8443
debian@ctrl:~$ kubectl get pods -n kubernetes-dashboard NAME READY STATUS RESTARTS AGE kubernetes-dashboard-api-668b9569d-xzjmp 1/1 Running 0 46s kubernetes-dashboard-auth-78c6bc6d94-jlh5w 1/1 Running 0 46s kubernetes-dashboard-kong-648658d45f-k5lrm 1/1 Running 0 46s kubernetes-dashboard-metrics-scraper-547874fcf-g9lw8 1/1 Running 0 46s kubernetes-dashboard-web-7796b9fbbb-bfwk7 1/1 Running 0 46s |
| [3] | Add a service account for the dashboard and configure it to have access to the dashboard. |
debian@ctrl:~$ kubectl create serviceaccount -n kubernetes-dashboard dashboard-admin serviceaccount/dashboard-admin created debian@ctrl:~$ vi rbac.yml # create new apiVersion: rbac.authorization.k8s.io/v1 kind: ClusterRoleBinding metadata: name: dashboard-admin roleRef: apiGroup: rbac.authorization.k8s.io kind: ClusterRole name: cluster-admin subjects: - kind: ServiceAccount name: dashboard-admin namespace: kubernetes-dashboard debian@ctrl:~$ kubectl apply -f rbac.yml clusterrolebinding.rbac.authorization.k8s.io/dashboard-admin created # get security token of the account above debian@ctrl:~$ kubectl -n kubernetes-dashboard create token dashboard-admin eyJhbGciOiJSUzI1NiIsI..... # set port-forwarding to access to dashboard debian@ctrl:~$ kubectl port-forward -n kubernetes-dashboard svc/kubernetes-dashboard-kong-proxy --address 0.0.0.0 8443:443 Forwarding from 0.0.0.0:8443 -> 8443 |
| [4] | Access to the URL below on a client computer in your local network. ⇒ https://(Control Plane Node Hostname or IP address):(setting port)/ After displaying following form, Copy and paste the security token you got on [2] to [Enter token] section and Click [Sing In] button. |
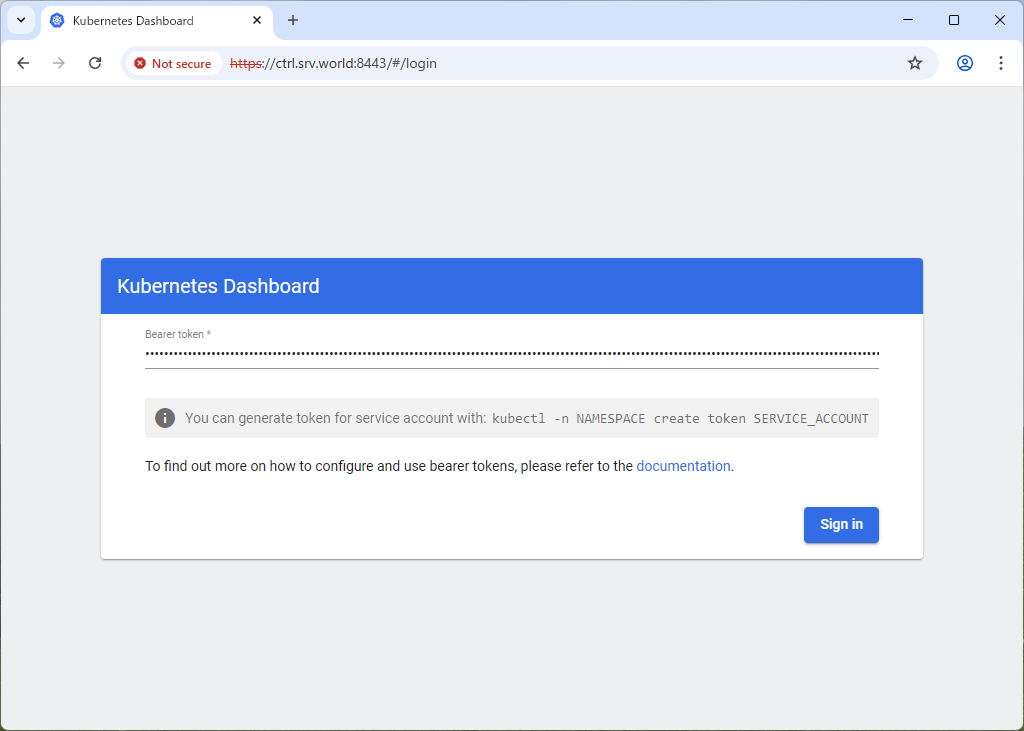 |
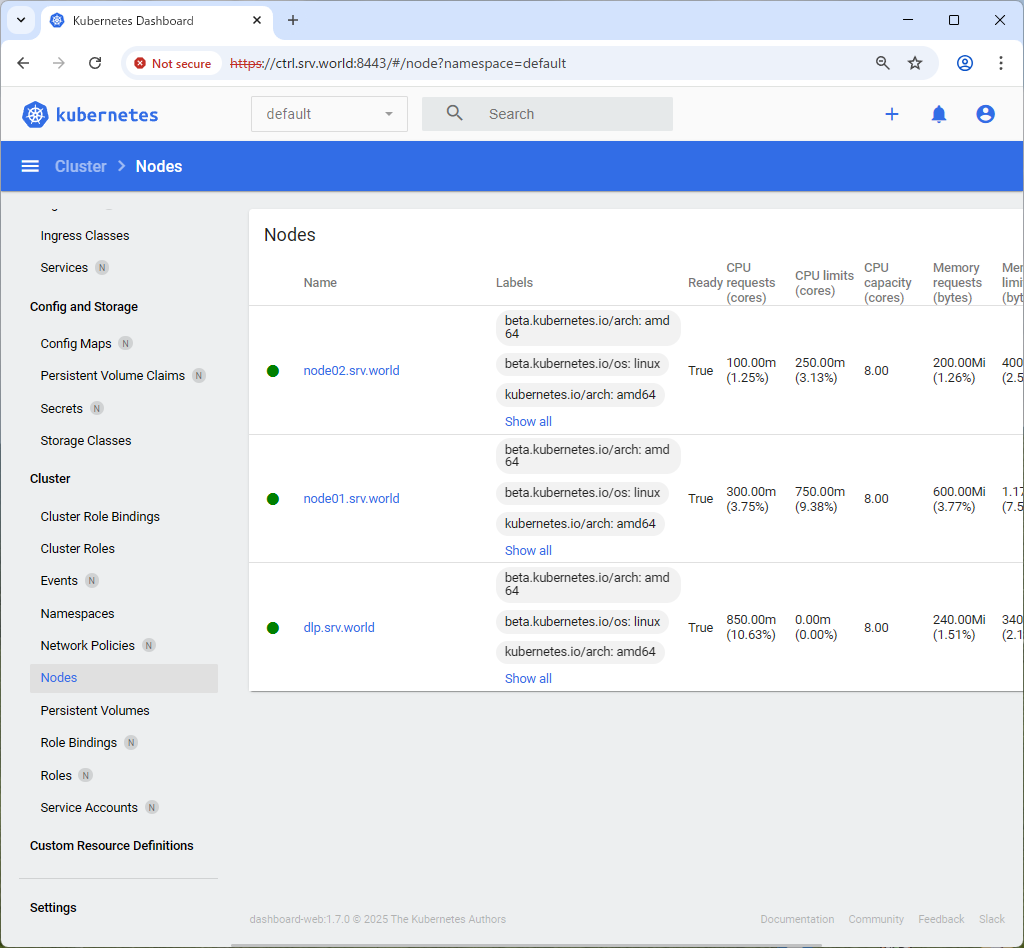
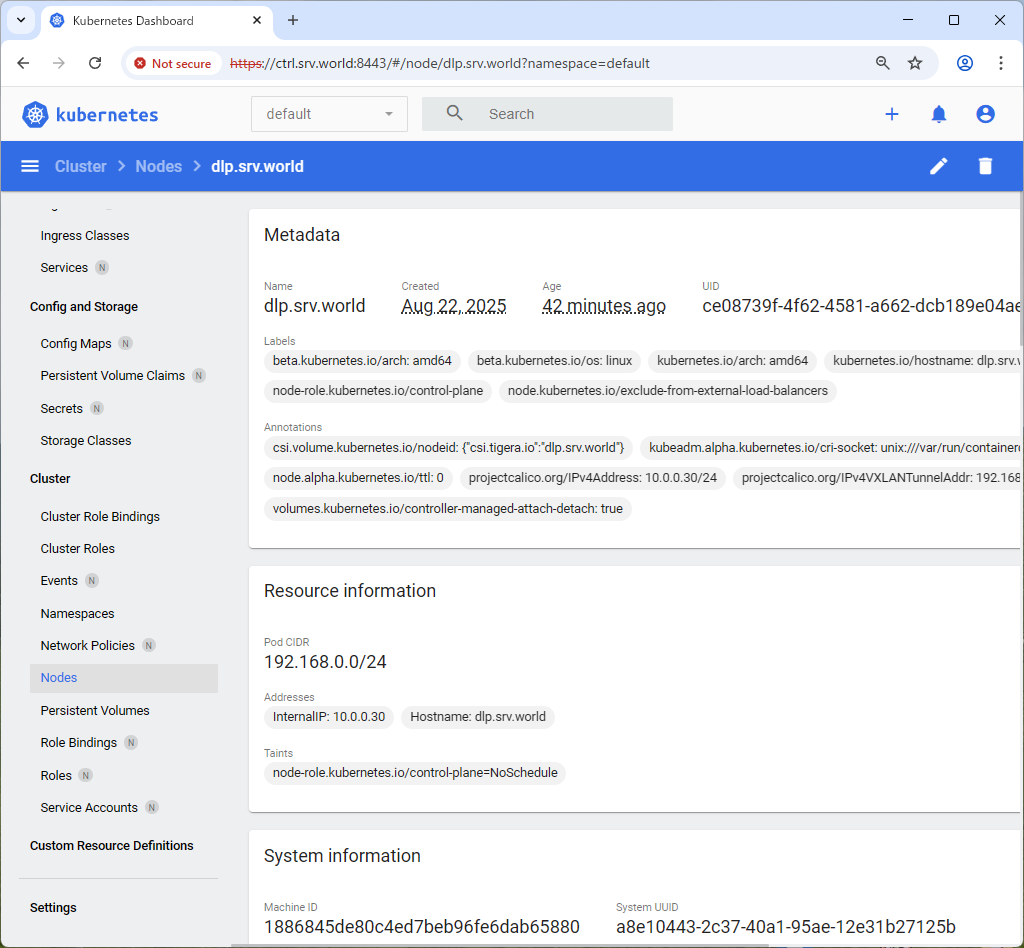
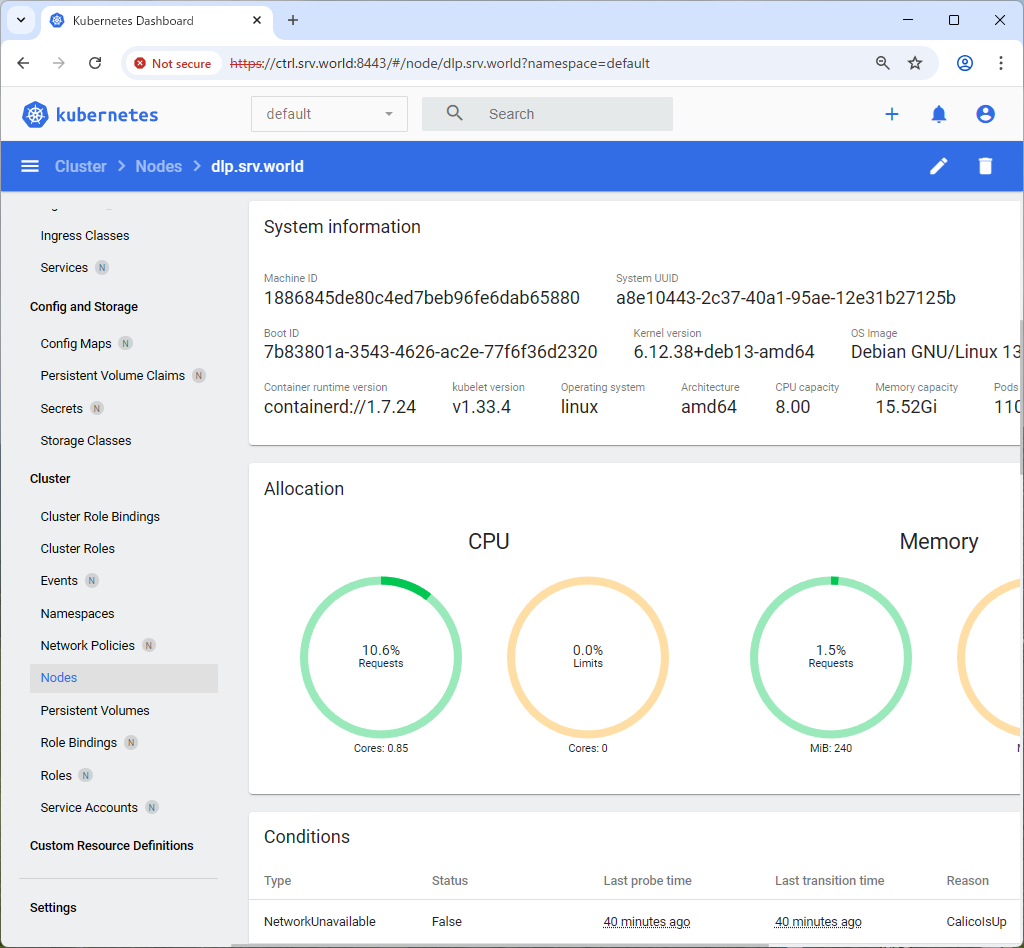
| [5] | After authentication successfully passed, Kubernetes Cluster Dashboard is displayed. |
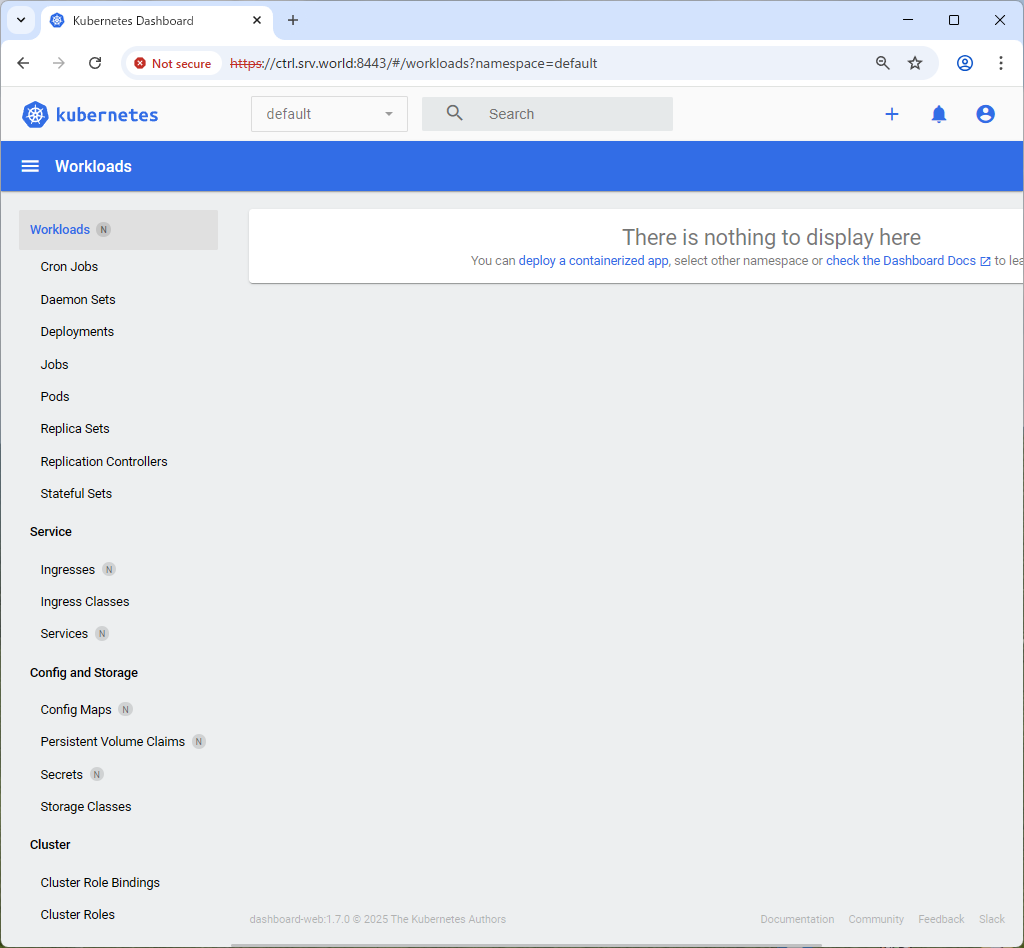 |
 |
 |
 |
No comments:
Post a Comment