Kubernetes : Deploy Prometheus
Deploy Prometheus to monitor metrics in Kubernetes Cluster. This example is based on the environment like follows. +----------------------+ +----------------------+
| [ ctrl.srv.world ] | | [ dlp.srv.world ] |
| Manager Node | | Control Plane |
+-----------+----------+ +-----------+----------+
eth0|10.0.0.25 eth0|10.0.0.30
| |
------------+--------------------------+-----------
| |
eth0|10.0.0.51 eth0|10.0.0.52
+-----------+----------+ +-----------+----------+
| [ node01.srv.world ] | | [ node02.srv.world ] |
| Worker Node#1 | | Worker Node#2 |
+----------------------+ +----------------------+
|
| [1] | Persistent storage is needed for Prometheus. |
| [2] | Install Prometheus chart with Helm. |
# output config and change some settings debian@ctrl:~$ helm inspect values bitnami/kube-prometheus > prometheus.yaml debian@ctrl:~$ vi prometheus.yaml .....
.....
line 21 : specify [storageClass] to use
defaultStorageClass: "nfs-client"
.....
.....
.....
line 1304 : specify [storageClass] to use
storageClass: "nfs-client"
.....
.....
.....
line 2418 : specify [storageClass] to use
storageClass: "nfs-client"
# create a namespace for Prometheus debian@ctrl:~$ kubectl create namespace monitoring namespace/monitoring created helm install prometheus --namespace monitoring -f prometheus.yaml bitnami/kube-prometheus NAME: prometheus
LAST DEPLOYED: Mon Aug 25 10:11:34 2025
NAMESPACE: monitoring
STATUS: deployed
REVISION: 1
TEST SUITE: None
NOTES:
CHART NAME: kube-prometheus
CHART VERSION: 11.3.10
APP VERSION: 0.85.0
WARNING: Since August 28th, 2025, only a limited subset of images/charts are available for free.
Subscribe to Bitnami Secure Images to receive continued support and security updates.
More info at https://bitnami.com and https://github.com/bitnami/containers/issues/83267
** Please be patient while the chart is being deployed **
Watch the Prometheus Operator Deployment status using the command:
kubectl get deploy -w --namespace monitoring -l app.kubernetes.io/name=kube-prometheus-operator,app.kubernetes.io/instance=prometheus
Watch the Prometheus StatefulSet status using the command:
kubectl get sts -w --namespace monitoring -l app.kubernetes.io/name=kube-prometheus-prometheus,app.kubernetes.io/instance=prometheus
Prometheus can be accessed via port "9090" on the following DNS name from within your cluster:
prometheus-kube-prometheus-prometheus.monitoring.svc.cluster.local
To access Prometheus from outside the cluster execute the following commands:
echo "Prometheus URL: http://127.0.0.1:9090/"
kubectl port-forward --namespace monitoring svc/prometheus-kube-prometheus-prometheus 9090:9090
Watch the Alertmanager StatefulSet status using the command:
kubectl get sts -w --namespace monitoring -l app.kubernetes.io/name=kube-prometheus-alertmanager,app.kubernetes.io/instance=prometheus
Alertmanager can be accessed via port "9093" on the following DNS name from within your cluster:
prometheus-kube-prometheus-alertmanager.monitoring.svc.cluster.local
To access Alertmanager from outside the cluster execute the following commands:
echo "Alertmanager URL: http://127.0.0.1:9093/"
kubectl port-forward --namespace monitoring svc/prometheus-kube-prometheus-alertmanager 9093:9093
WARNING: There are "resources" sections in the chart not set. Using "resourcesPreset" is not recommended for production. For production installations, please set the following values according to your workload needs:
- alertmanager.resources
- blackboxExporter.resources
- operator.resources
- prometheus.resources
- prometheus.thanos.resources
+info https://kubernetes.io/docs/concepts/configuration/manage-resources-containers/
debian@ctrl:~$ kubectl get pods -n monitoring NAME READY STATUS RESTARTS AGE alertmanager-prometheus-kube-prometheus-alertmanager-0 2/2 Running 0 6m11s prometheus-kube-prometheus-blackbox-exporter-56fbc9c9c6-4sxnr 1/1 Running 0 6m29s prometheus-kube-prometheus-operator-7994f6c9d5-jtpwt 1/1 Running 0 6m29s prometheus-kube-state-metrics-86b8765cd5-wpf7l 1/1 Running 0 6m29s prometheus-node-exporter-8lpvb 1/1 Running 0 6m29s prometheus-node-exporter-rrn2p 1/1 Running 0 6m29s prometheus-prometheus-kube-prometheus-prometheus-0 2/2 Running 0 6m11s # if access from outside of cluster, set port-forwarding debian@ctrl:~$ kubectl port-forward -n monitoring service/prometheus-kube-prometheus-prometheus --address 0.0.0.0 9090:9090 & |
| [3] | If you deploy Grafana, too, It's possible like follows. |
# output config and change some settings debian@ctrl:~$ helm inspect values bitnami/grafana > grafana.yaml debian@ctrl:~$ vi grafana.yaml # line 638 : change to your [storageClass] persistence: enabled: true ## If defined, storageClassName: <storageClass> ## If set to "-", storageClassName: "", which disables dynamic provisioning ## If undefined (the default) or set to null, no storageClassName spec is ## set, choosing the default provisioner. (gp2 on AWS, standard on ## GKE, AWS & OpenStack) ## storageClass: "nfs-client"debian@ctrl:~$ helm install grafana --namespace monitoring -f grafana.yaml bitnami/grafana NAME: grafana
LAST DEPLOYED: Mon Aug 25 10:19:16 2025
NAMESPACE: monitoring
STATUS: deployed
REVISION: 1
TEST SUITE: None
NOTES:
CHART NAME: grafana
CHART VERSION: 12.1.8
APP VERSION: 12.1.1
WARNING: Since August 28th, 2025, only a limited subset of images/charts are available for free.
Subscribe to Bitnami Secure Images to receive continued support and security updates.
More info at https://bitnami.com and https://github.com/bitnami/containers/issues/83267
** Please be patient while the chart is being deployed **
1. Get the application URL by running these commands:
echo "Browse to http://127.0.0.1:8080"
kubectl port-forward svc/grafana 8080:3000 &
2. Get the admin credentials:
echo "User: admin"
echo "Password: $(kubectl get secret grafana-admin --namespace monitoring -o jsonpath="{.data.GF_SECURITY_ADMIN_PASSWORD}" | base64 -d)"
# Note: Do not include grafana.validateValues.database here. See https://github.com/bitnami/charts/issues/20629
WARNING: There are "resources" sections in the chart not set. Using "resourcesPreset" is not recommended for production. For production installations, please set the following values according to your workload needs:
- grafana.resources
+info https://kubernetes.io/docs/concepts/configuration/manage-resources-containers/
debian@ctrl:~$ kubectl get pods -n monitoring NAME READY STATUS RESTARTS AGE alertmanager-prometheus-kube-prometheus-alertmanager-0 2/2 Running 0 8m18s grafana-b566c7d5c-xtknt 1/1 Running 0 56s prometheus-kube-prometheus-blackbox-exporter-56fbc9c9c6-4sxnr 1/1 Running 0 8m36s prometheus-kube-prometheus-operator-7994f6c9d5-jtpwt 1/1 Running 0 8m36s prometheus-kube-state-metrics-86b8765cd5-wpf7l 1/1 Running 0 8m36s prometheus-node-exporter-8lpvb 1/1 Running 0 8m36s prometheus-node-exporter-rrn2p 1/1 Running 0 8m36s prometheus-prometheus-kube-prometheus-prometheus-0 2/2 Running 0 8m18s # if access from outside of cluster, set port-forwarding debian@ctrl:~$ kubectl port-forward -n monitoring service/grafana --address 0.0.0.0 3000:3000 & |
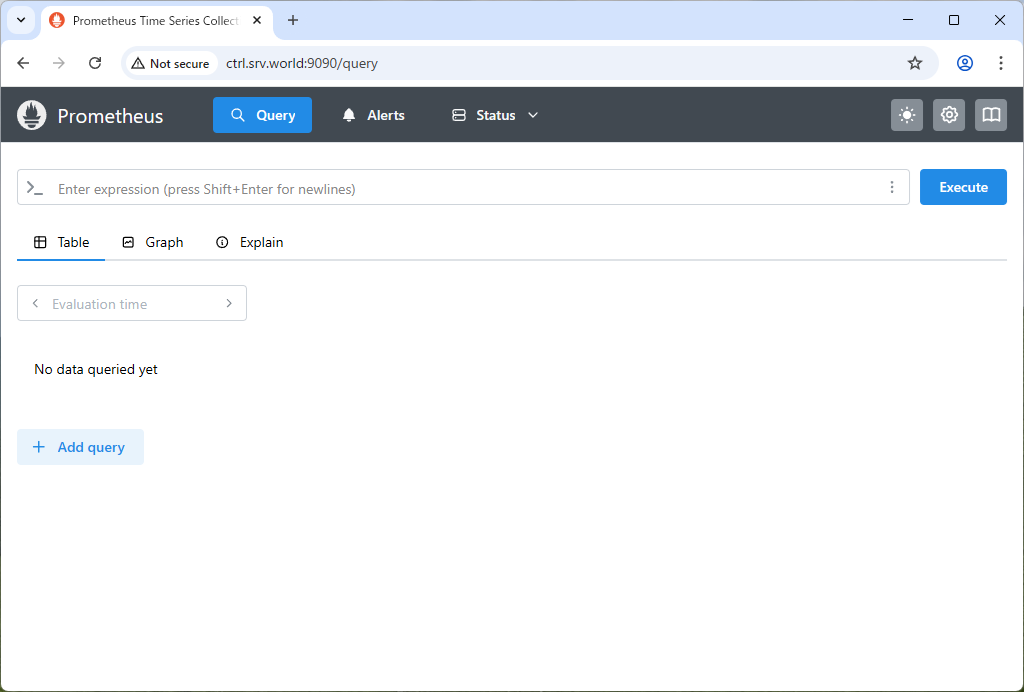
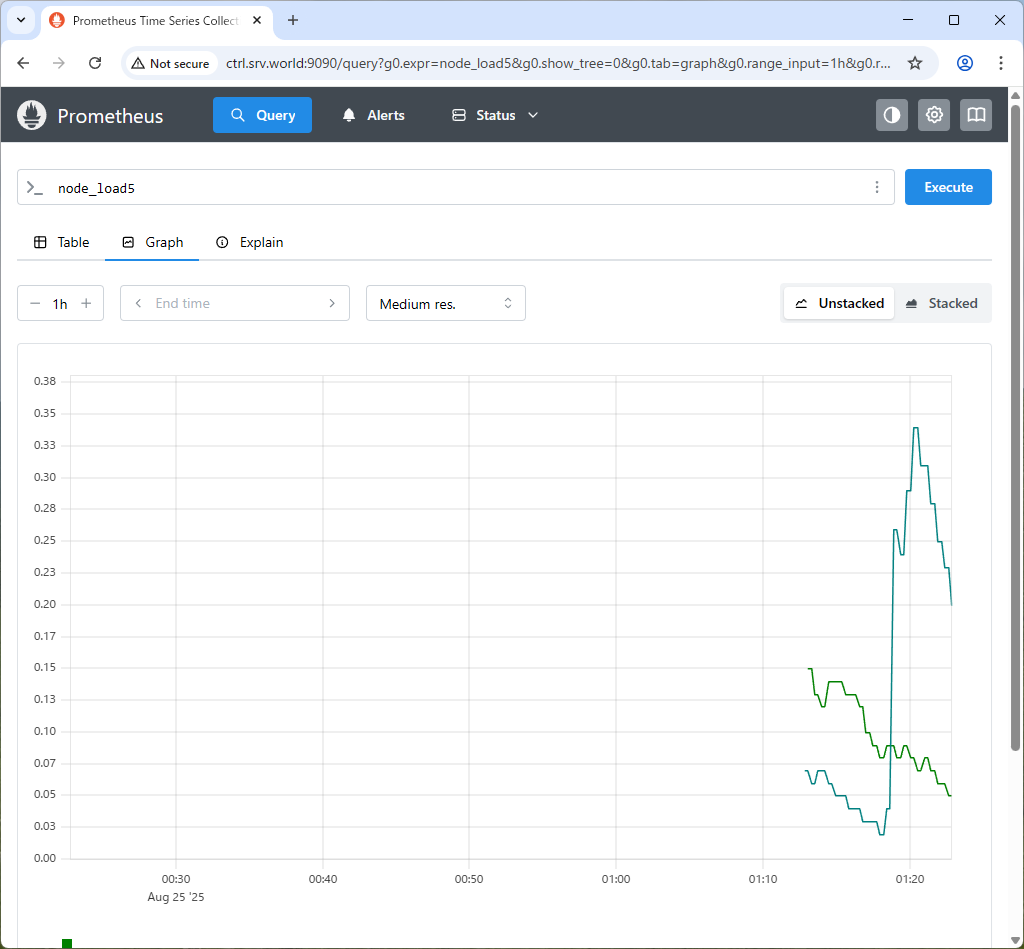
| [4] | If you access to Prometheus UI from a Host in cluster, access to the URL below with an Web browser. ⇒ http://prometheus-kube-prometheus-prometheus.monitoring.svc.cluster.local If you set port-forwarding, access to the URL below on a client computer in your local network. ⇒ http://(Manager Node Hostname or IP address):(setting port)/ That's OK if following Prometheus UI is displayed. |
 |
 |
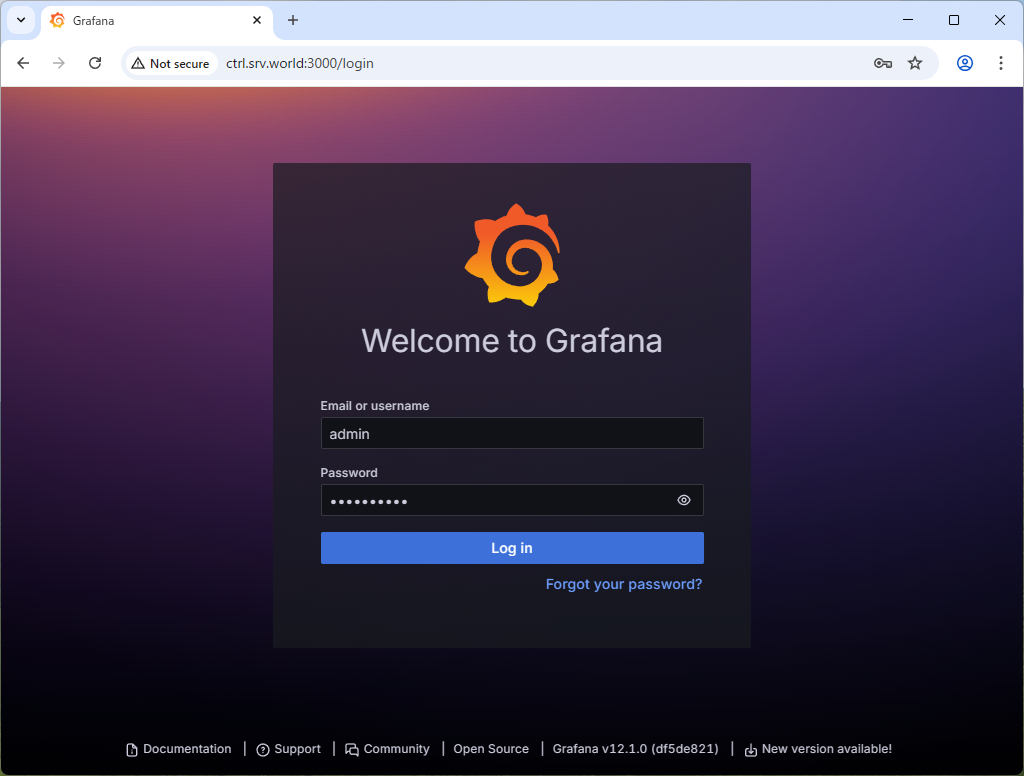
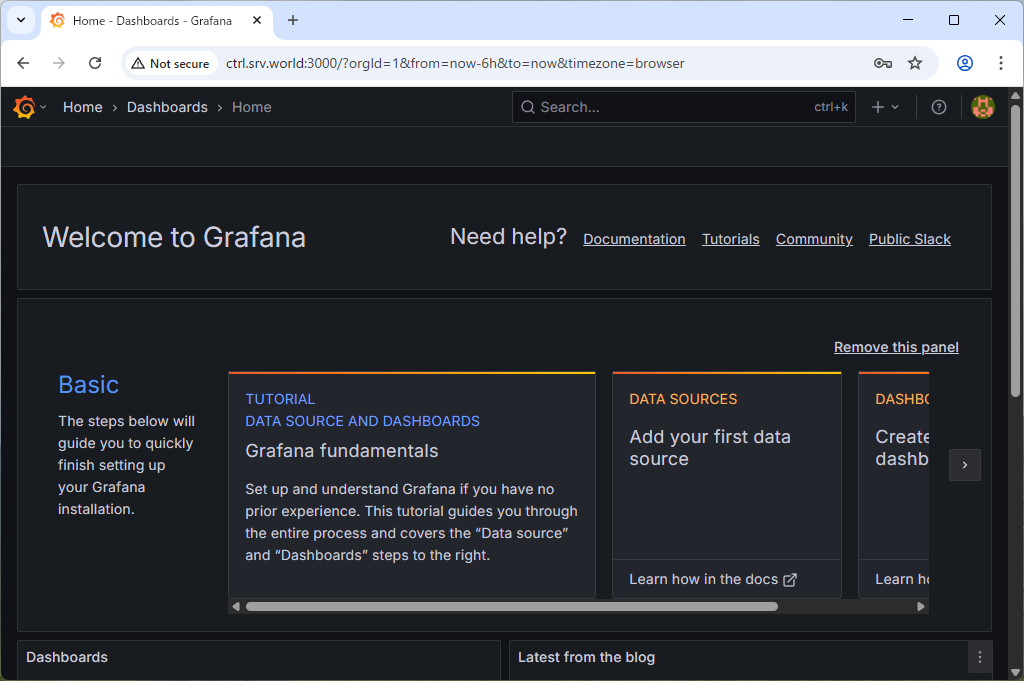
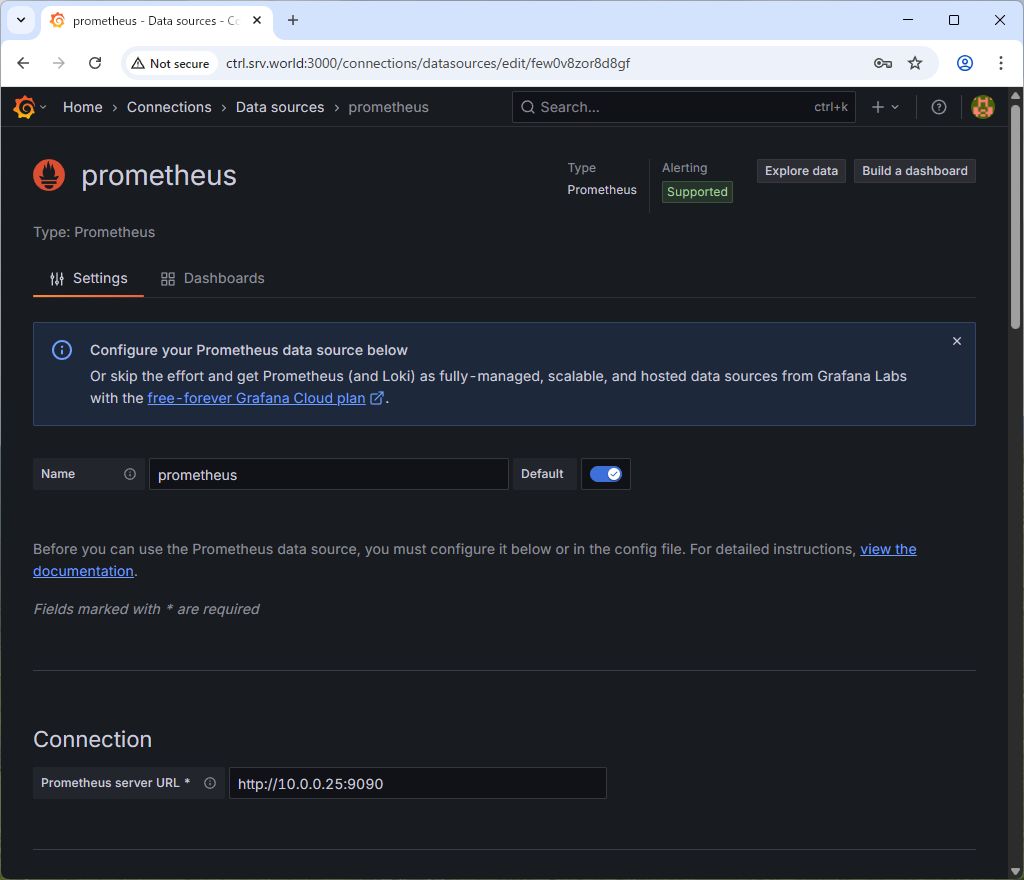
| [5] | If you access to Grafana from a Host in cluster, access to the URL below with an Web browser. ⇒ http://grafana.monitoring.svc.cluster.local If you set port-forwarding, access to the URL below on a client computer in your local network. ⇒ http://(Manager Node Hostname or IP address):(setting port)/ That's OK if following Grafana UI is displayed. For [admin] password, it's possible to confirm with the command below.⇒ echo "Password: $(kubectl get secret grafana-admin --namespace monitoring -o jsonpath="{.data.GF_SECURITY_ADMIN_PASSWORD}" | base64 -d)" |
 |
 |
 |
 |
 |
No comments:
Post a Comment