InfluxDB : Visualize with Grafana |
It's possible to visualize time series data on InfluxDB with Grafana. | |
| [1] |
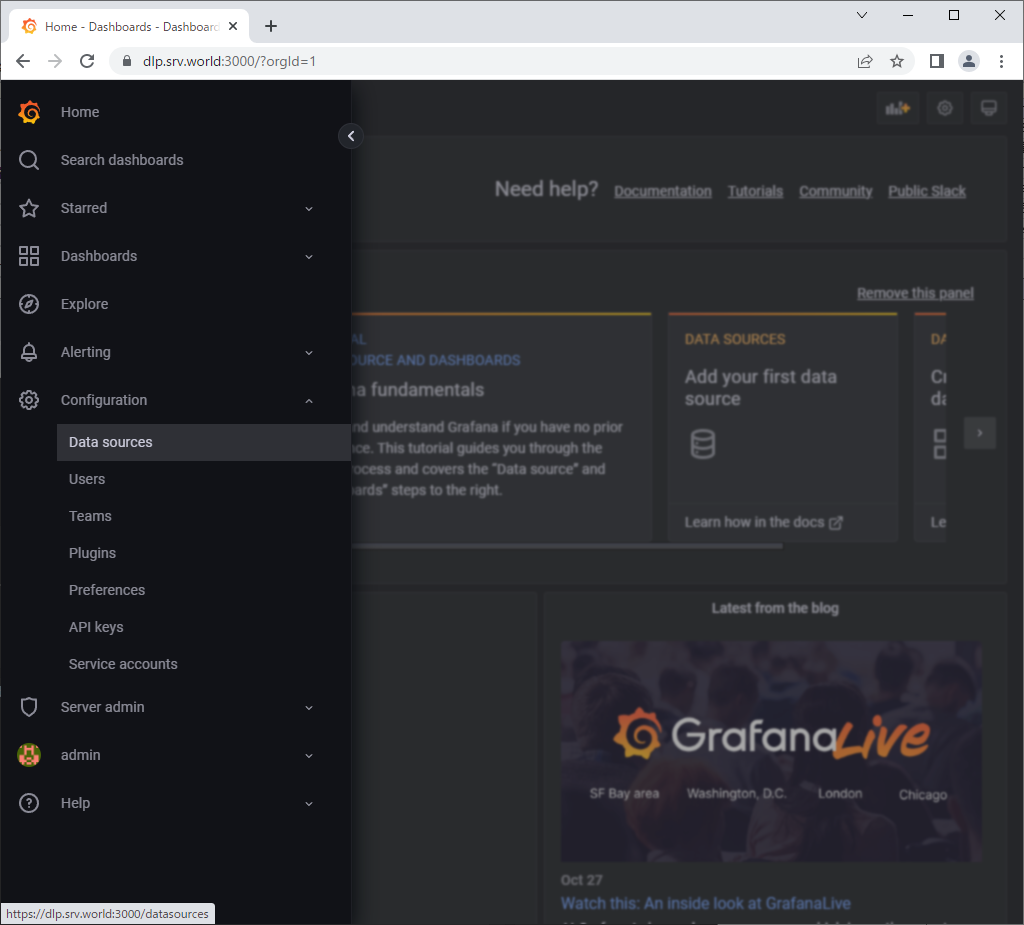
| [2] | Access to Grafana Dashboard and Open [Configuration] - [Data Sources] on the left menu. |
 |
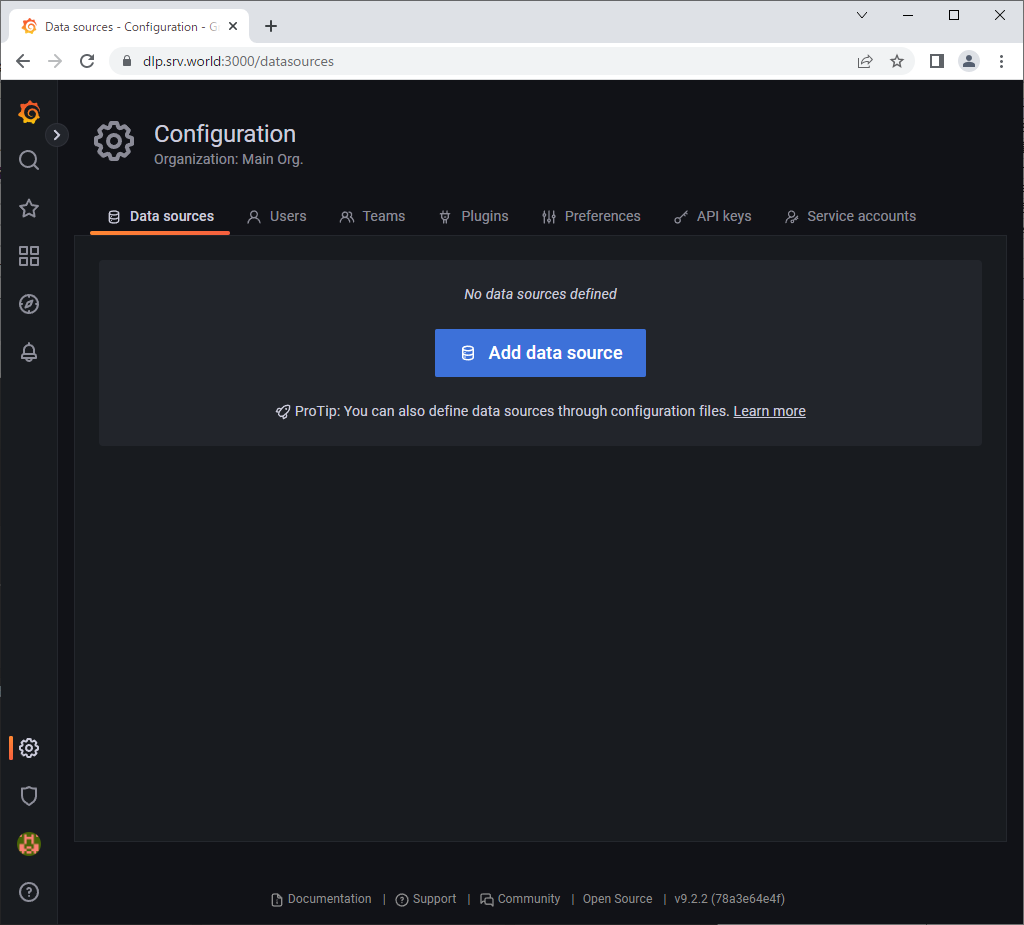
| [3] | Click [Add data source]. |
 |
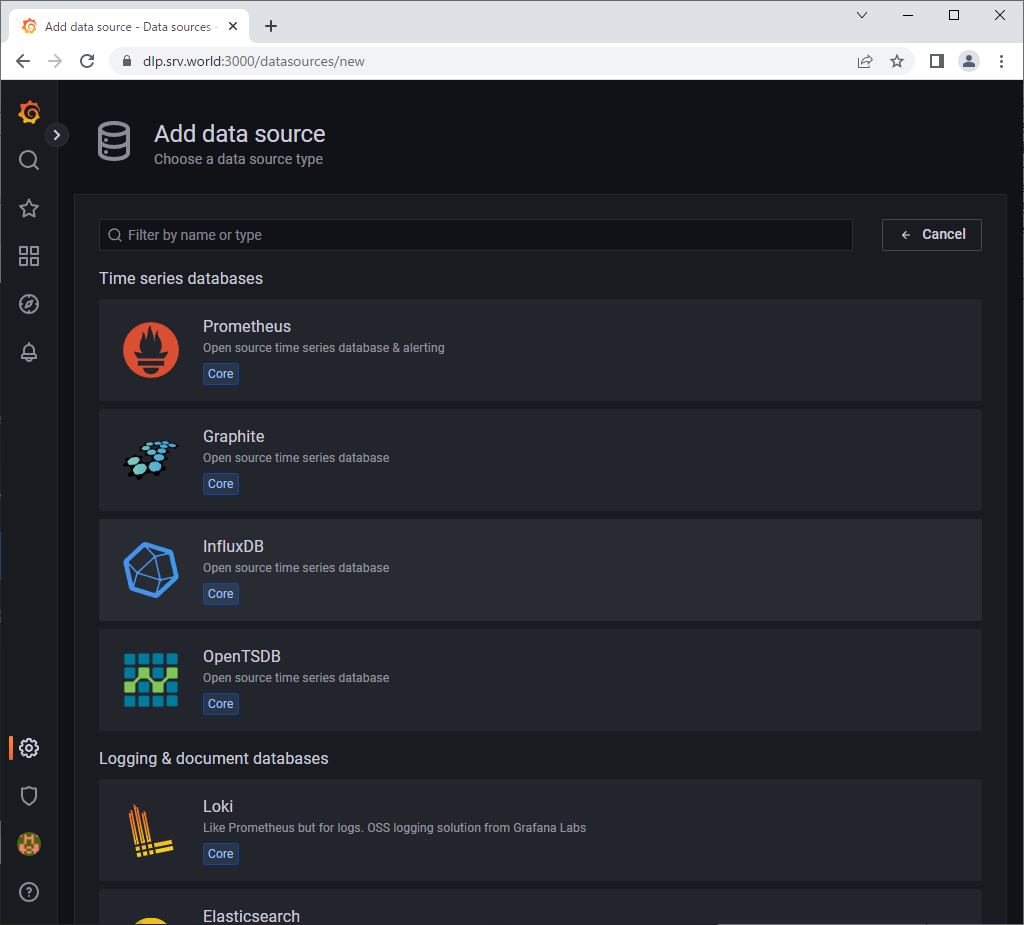
| [4] | Click [InfluxDB]. |
 |
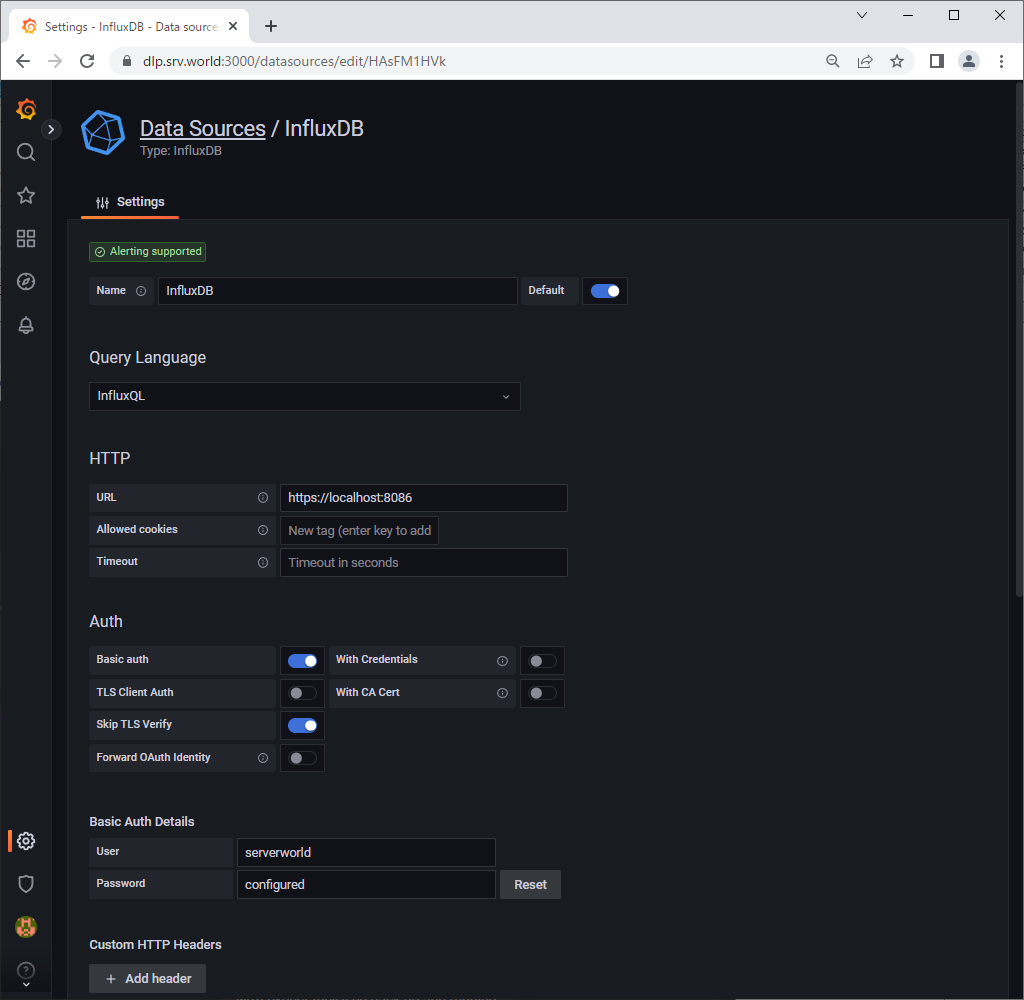
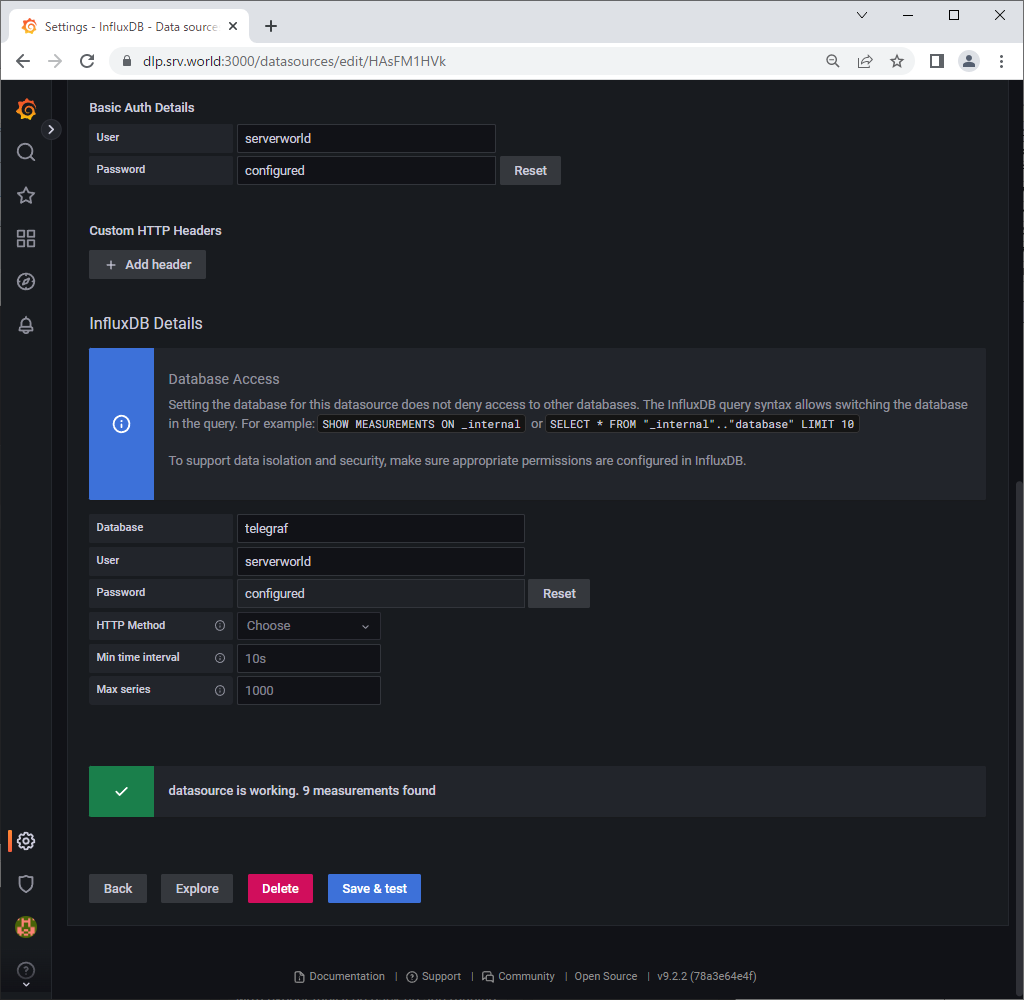
| [5] | Input InfluxDB Server endpoint URL on [HTTP] section. For [Auth] section, if you enabled authentication or SSL/TLS and so on, turn to On/Off for your needs. For [Basic Auth Details] or [InfluxDB Details] section, input information for them. After inputting required information, click [Save & Test] button, then that's OK if the message [Data source is working] is shown. |
 |
 |
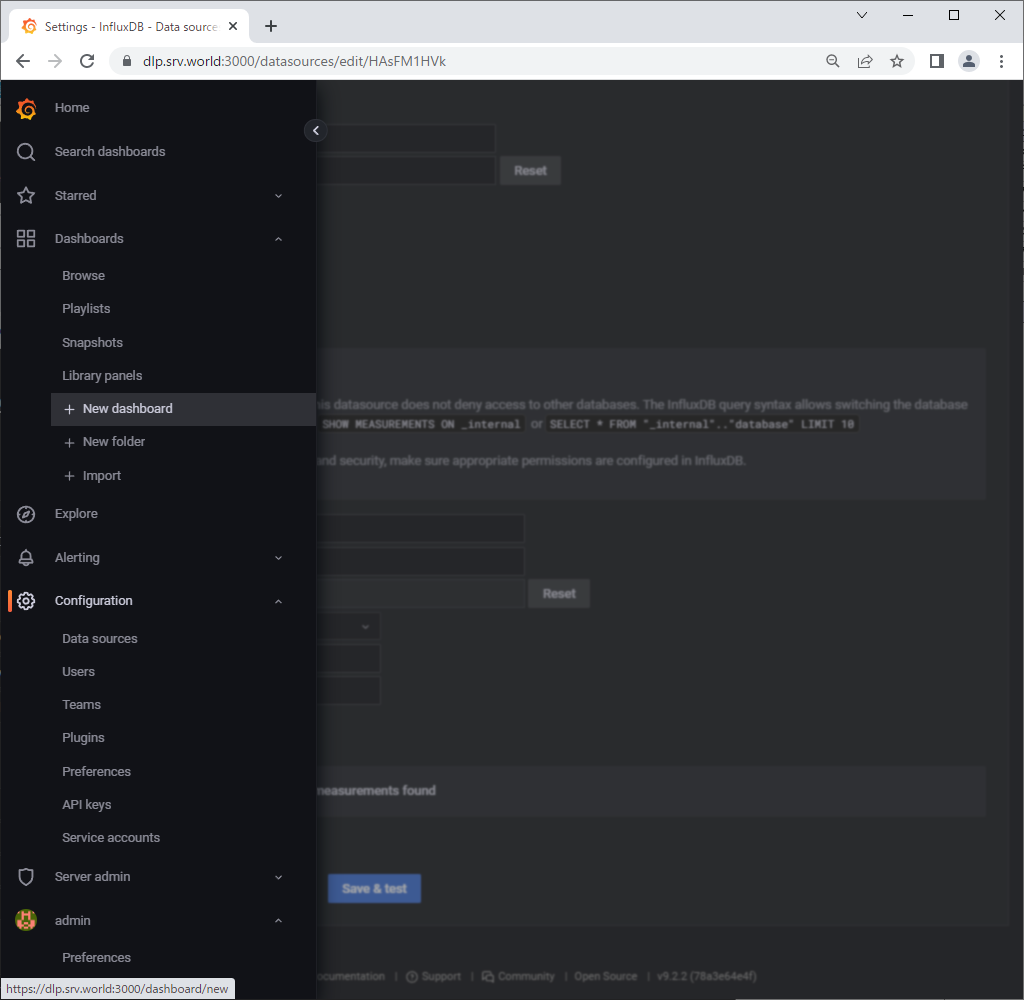
| [6] | Click [Dashboards] - [New Dashboard] on the left pane. |
 |
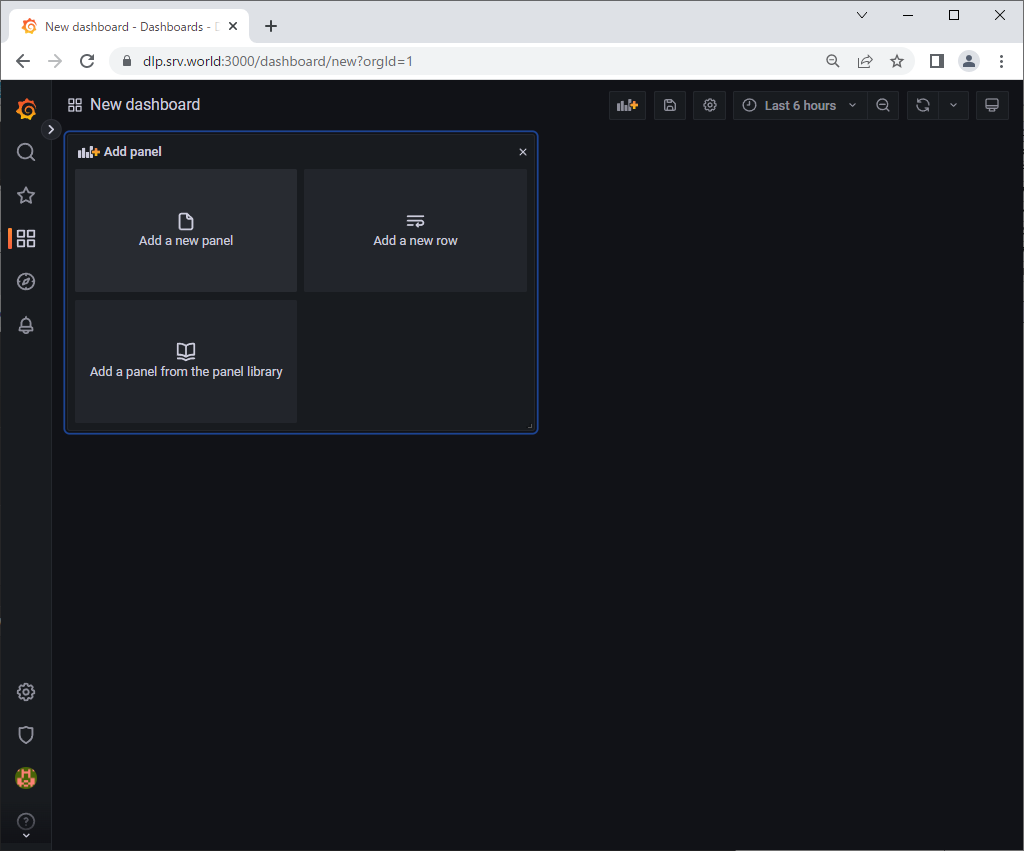
| [7] | Click [Add a new panel]. |
 |
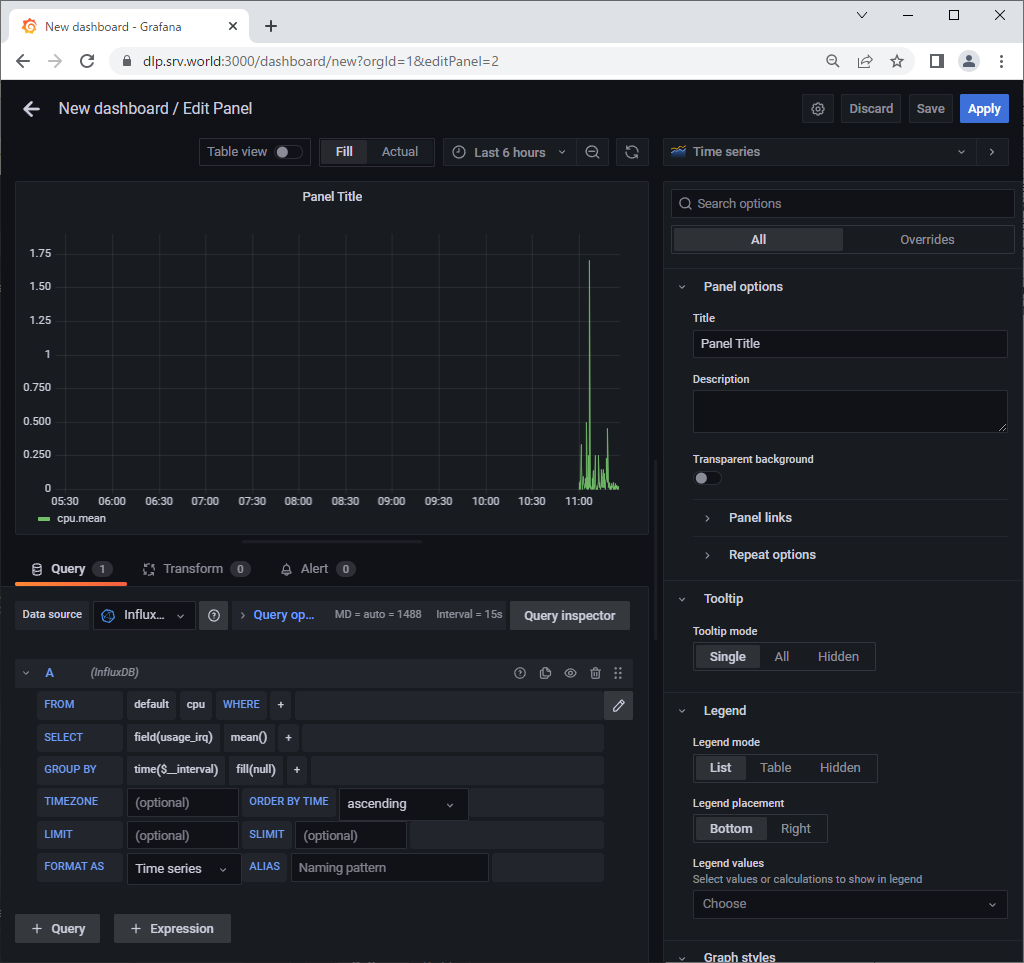
| [8] | Select a query you'd like to visualize data on [From] or [Select] field. If that's OK, click [Apply] button which is upper-right. |
 |
| [9] | To save Dashboard, click [Save Dashboard] icon. |
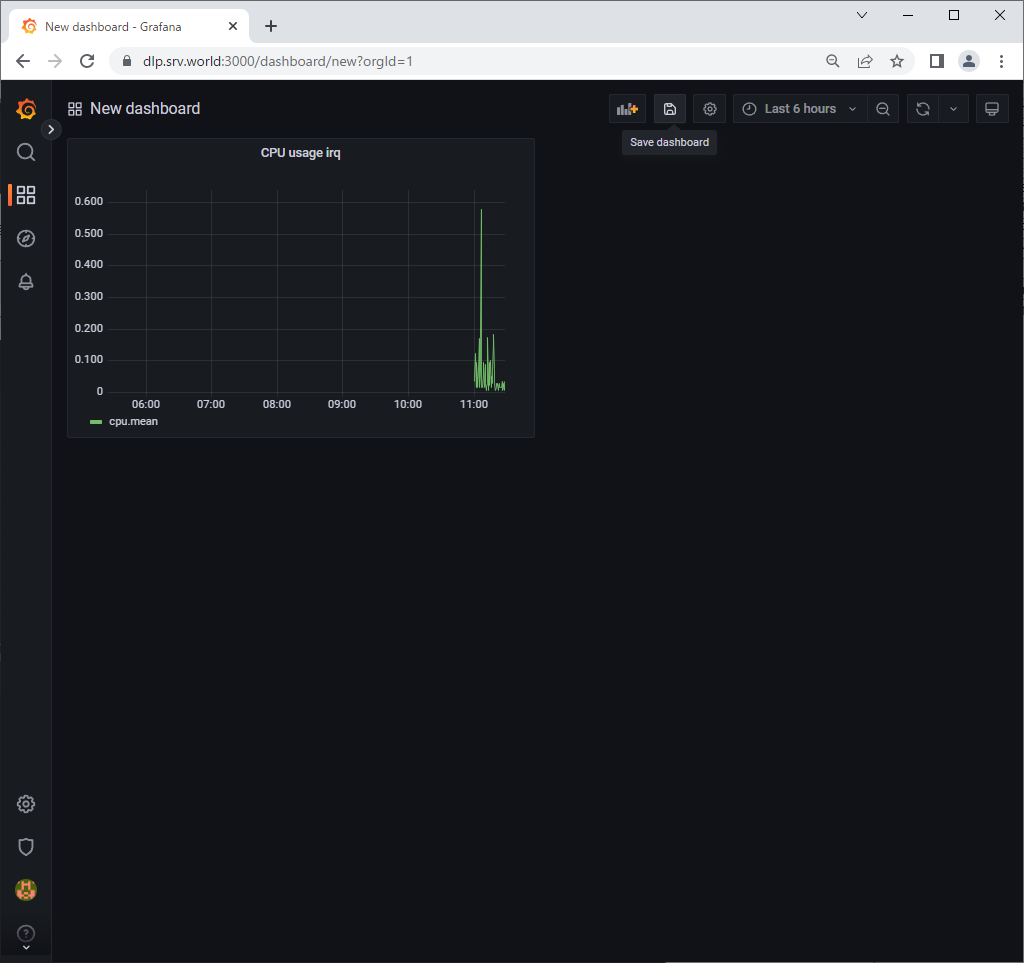 |
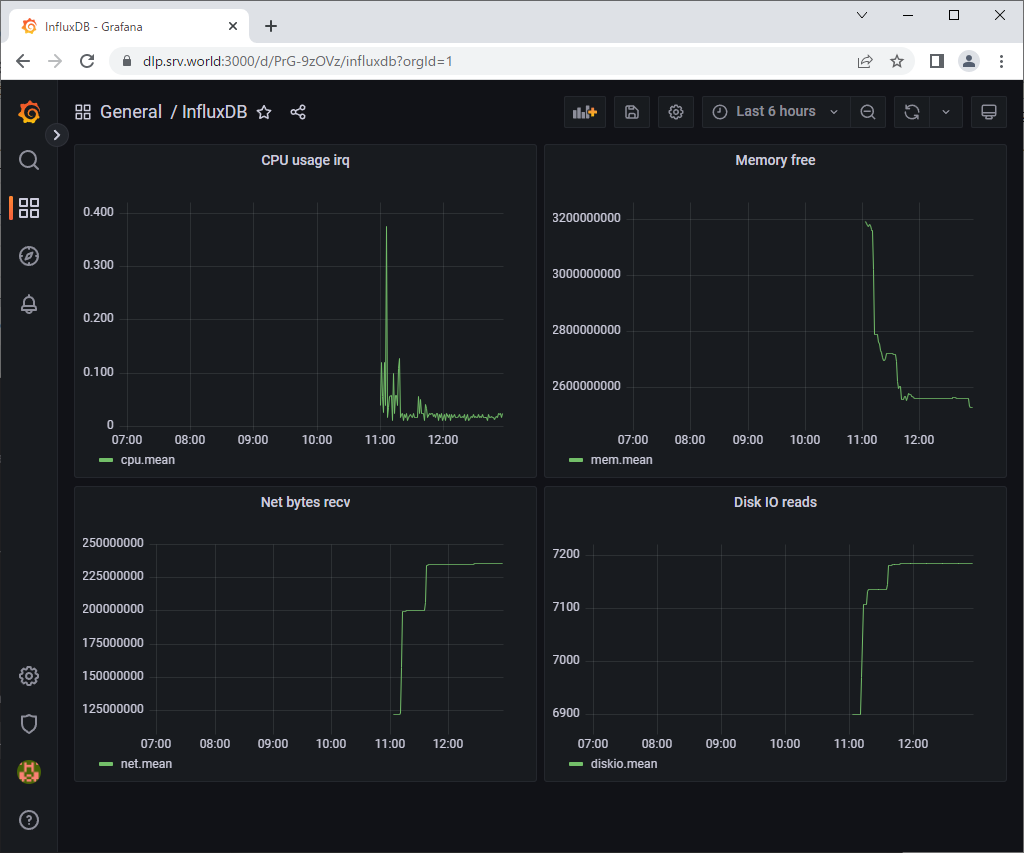
| [10] | To add more queries, it's possible to put more Graphs on a Dashboard. |
 |
No comments:
Post a Comment